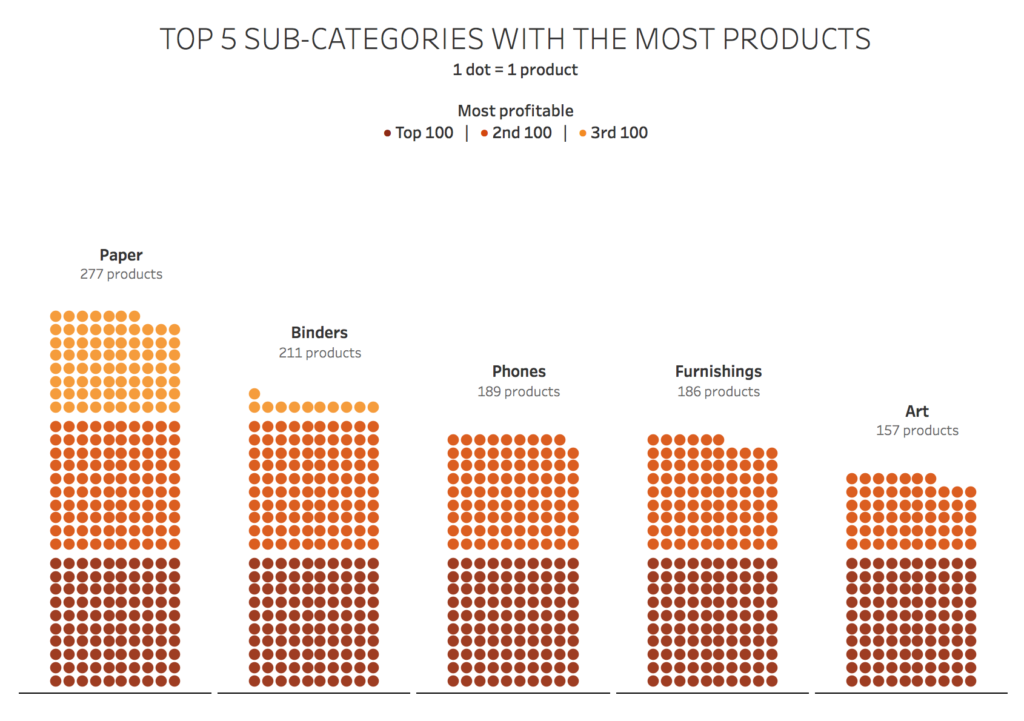
Week 15: Total Products by Sub-Category OR Top 5 Sub-Categories by Total Product
I’m back from a one month hiatus! Hopefully you enjoyed the guest posts from Curtis Harris and Ann Jackson. This week were giving you two options: Intermediate or Jedi. Both are a play on an olympics visualization I put together a month ago. The Intermediate requires just a handful of calculations. The Jedi looks just …
Week 15: Total Products by Sub-Category OR Top 5 Sub-Categories by Total Product Read More