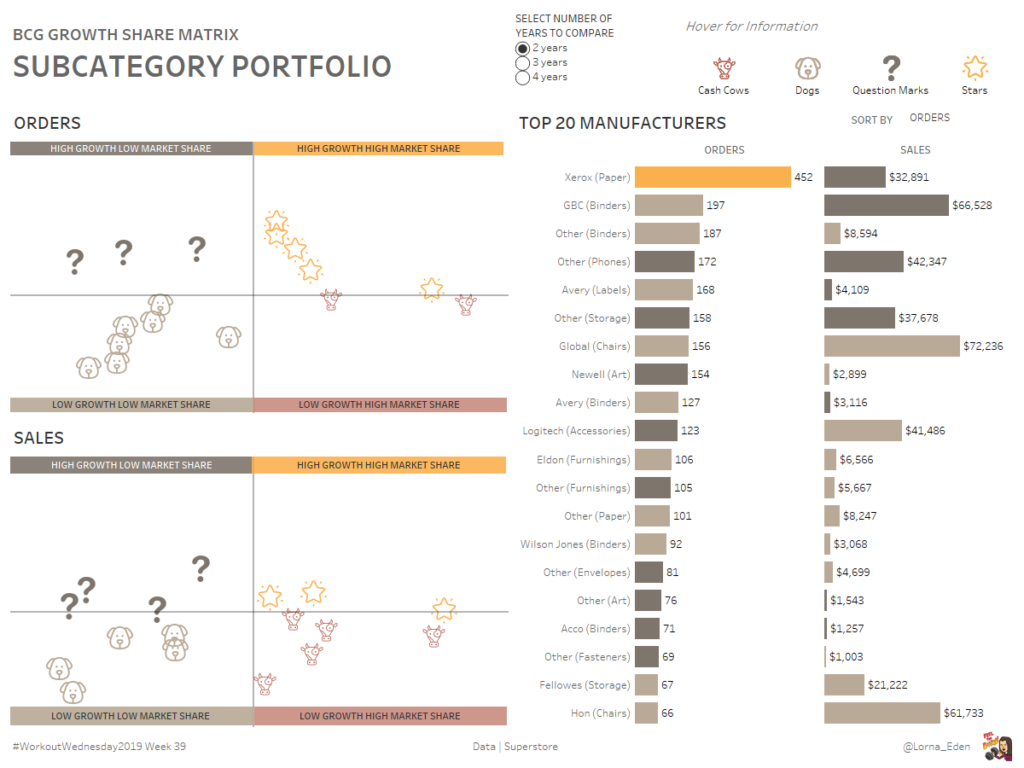
Week 39: Can you create a BCG growth share matrix with Sales and Orders?
This week’s #WorkoutWednesday idea comes from creating a product portfolio. The customer wanted to see how much a product has grown and what it’s market share was. We are going to recreate the BCG Growth-Share Matrix for our superstore sub categories and manufacturers. “The BCG Growth-Share Matrix is a portfolio planning model developed by Bruce …
Week 39: Can you create a BCG growth share matrix with Sales and Orders? Read More