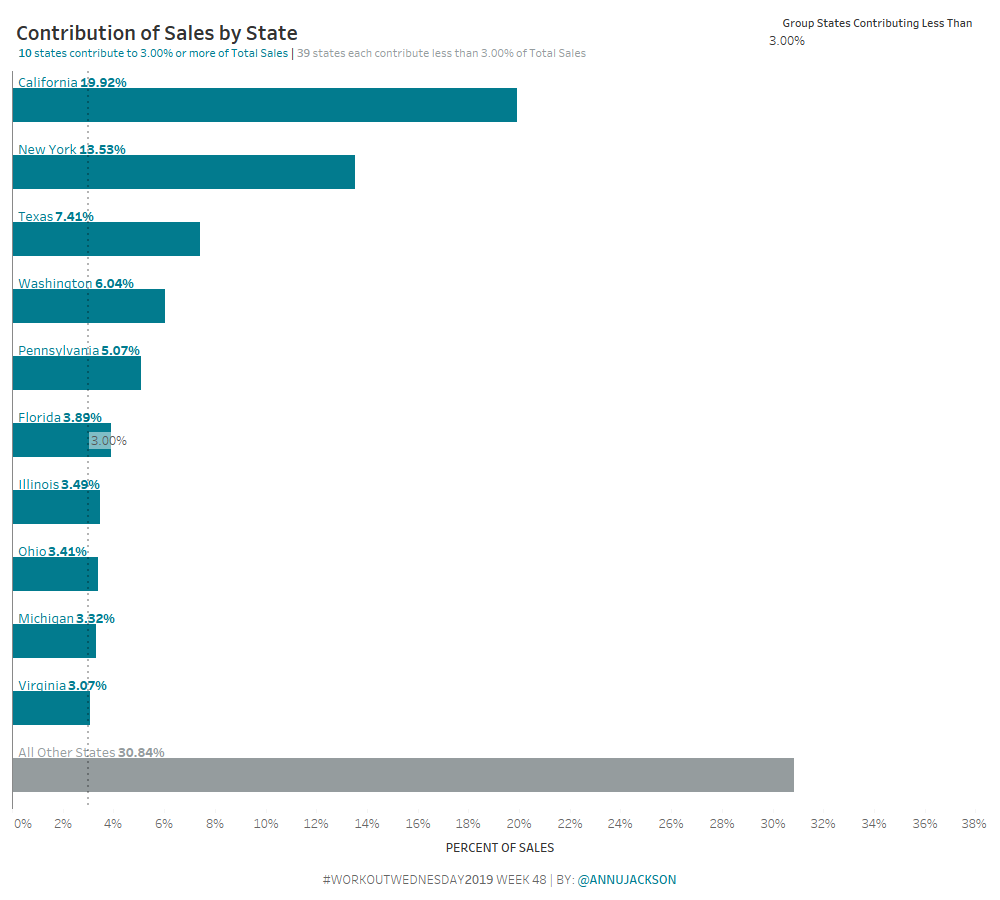
Week 48: Can you build a Bar Chart that automatically combines small contributions?
How much information have you retained from Tableau Conference 2019? Are you still watching session videos (like I am?). This challenge is an homage to the amazing conference from this year. The challenge comes from something I encountered in a recent work situation. The end-user wanted to be able to automatically group together small contributing …
Week 48: Can you build a Bar Chart that automatically combines small contributions? Read More