CRM Analytics

CRM Analytics: Quasi-Histogram – SOLUTION

Introduction Last week the challenge was how to create a quasi-histogram in CRM Analytics. Here is my solution, hope you guys like it. If you used a different solution, share it with us in the comments. Solution Let’s start by getting any numeric value from our dataset. You can upload your dataset. I am using …

CRM Analytics: Quasi-Histogram – SOLUTION Read More

2024 Week 27 | CRM Analytics: Quasi-Histogram

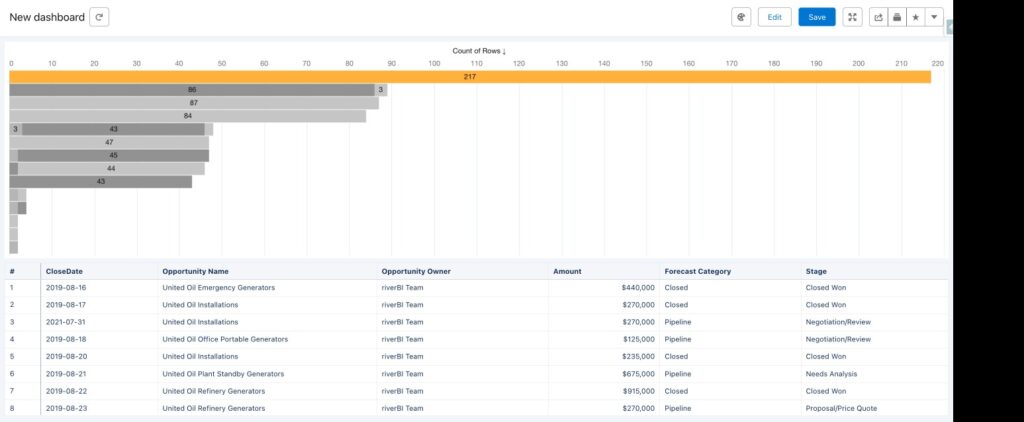
Introduction Hello again, everyone. One of the things that CRM Analytics misses in its variety of charts is a histogram. A histogram is a chart that displays the frequency (count) of rows within a range of numeric values. For example: you have opportunity records with several amounts (2500,3000,5000.8750.10000, etc). In a histogram, we’d create a …

2024 Week 27 | CRM Analytics: Quasi-Histogram Read More

2024 Week 23 – Account without Activities in the last 6 months

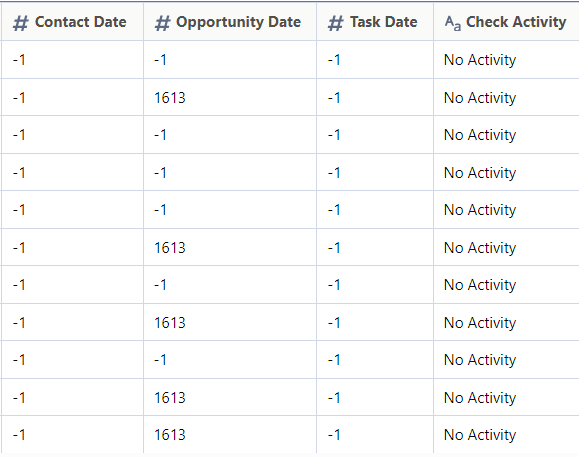
Introduction In addition to the powerful dashboard offered by CRM Analytics, the tool also offers a powerful data transformation tool, the Recipe. This week, the challenge is not the dashboard itself but preparing data based on a requirement.  Requirement: retrieve all Customers without “activity” in the last 6 months. Activity here means: – Opportunity creation– Contact …

2024 Week 23 – Account without Activities in the last 6 months Read More

2024 Week 22 – Top 4 industries + “Other”

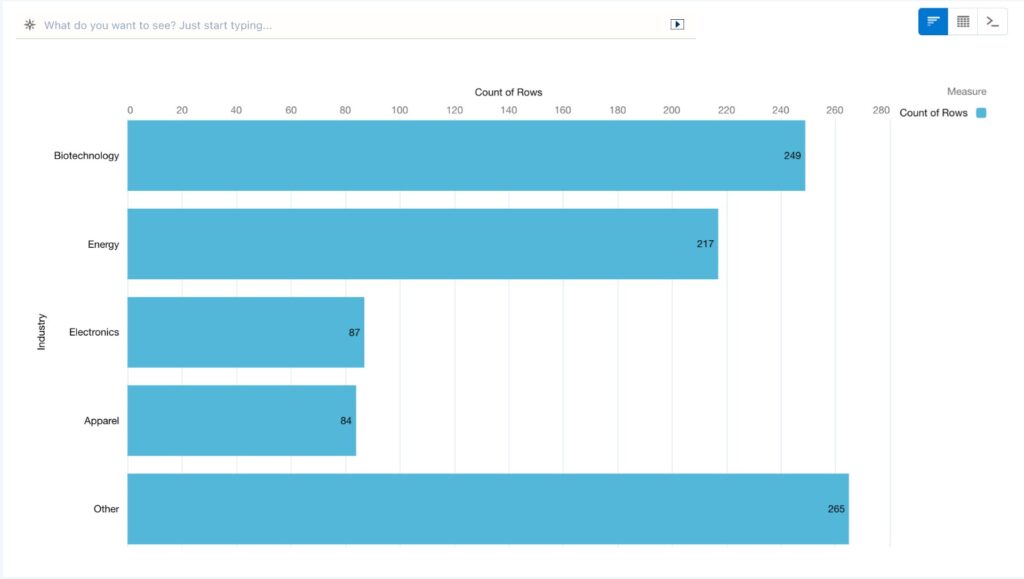
Introduction Hello again, everyone. As data analysts, we are frequently asked to present the “Top N” group members sorted by a metric. In this blog, we’ll try to bring the top 4 accounts industries sorted by count, and group all the following members in a single “Other” bar below the top 4 ones. Requirements Create …

2024 Week 22 – Top 4 industries + “Other” Read More

Scroll to Top