Year: 2023

2023 Week 52 | Power BI: Format Bar Charts with Transparency, Borders, and Detail Labels

Introduction In the December 2023 release of Power BI Desktop, some new formatting options were added for bar charts. These enhancements allow us to add borders around bars (and segments of bars for stacked bar charts), change the transparency of the fill color in a bar, and add secondary metrics to data labels.  With the …

2023 Week 52 | Power BI: Format Bar Charts with Transparency, Borders, and Detail Labels Read More

2023 Week 50 | Power BI: Clippy’s Random Gift Generator

Introduction Happy holidays to everyone who celebrates! Join us this week to get some help shopping for your friends and family, using a dataset you provide and a random number generator in Power Query. If Clippy can’t pick a gift, no one can! Have fun and create the random gift generator in whatever way you …

2023 Week 50 | Power BI: Clippy’s Random Gift Generator Read More

2023 W49: Can you find how many quarters it took for a customer to order again?

Introduction This week I wanted an easier challenge in the lead up to the Christmas Holidays. So what better way than doing some Level of Detail calculations. I want you to be able to find out how many quarters it took for a customer to make their second purchase Click to open in Tableau Public …

2023 W49: Can you find how many quarters it took for a customer to order again? Read More

ring chart

2023 Week 48 | Power BI: Ring Chart

Introduction This week’s challenge uses a few layering techniques in the Deneb custom visual. Here you will be challenged to use multiple independent scales on a layered plot. Advanced users can concatenate total bars for extra credit! Requirements Power Query Obtain the dataset from Github Model and load data Power BI Desktop Obtain Deneb from …

2023 Week 48 | Power BI: Ring Chart Read More

#WOW2023 | Week 48 | Can you add candlesticks to bar charts?

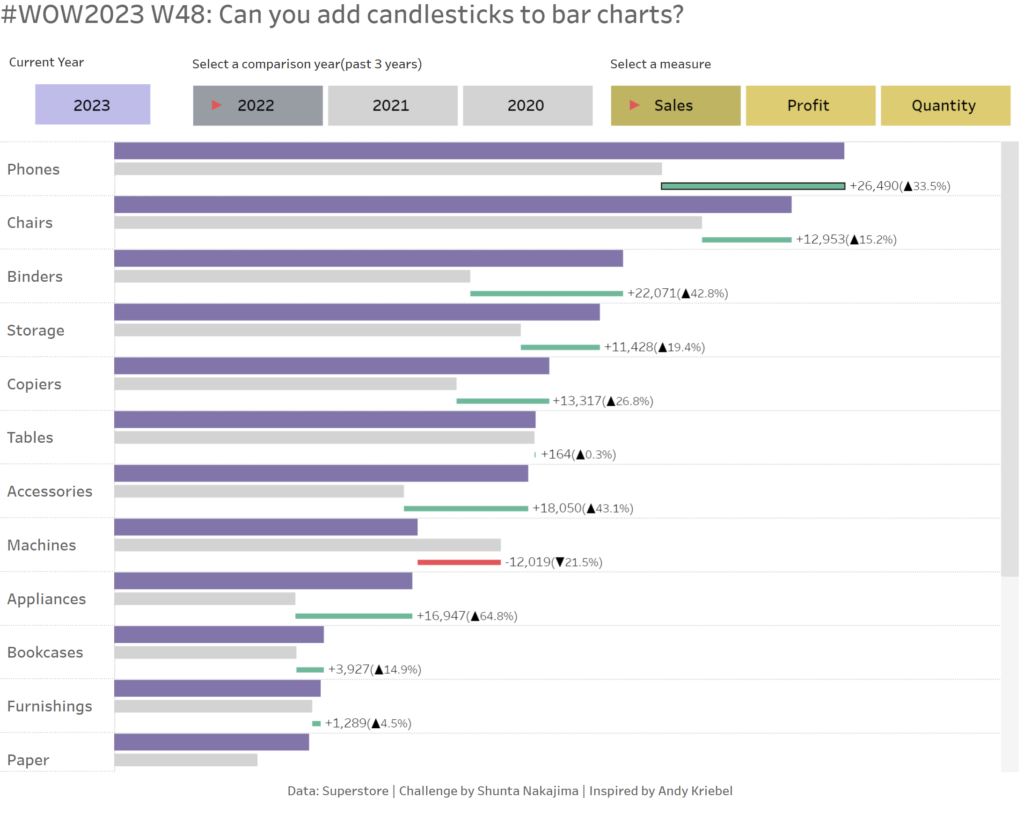
Introduction As we finish up Global Recognition Month, I’d like to introduce you to Shunta Nakajima (@Dandee_House), a BI Engineer from Japan who has been a regular participant in #WOW2023 challenges.  Over to you Shunta…. [JP] 私がWorkoutWednesdayを知ったのが2020年、それ以来約3年間多くのチャレンジに取り組み、非常にたくさんのことを学ぶことができました。WOWのおかげで、私のTableauスキルを向上させることができました。今回、ゲストとして私のチャレンジを紹介できることになり、非常にワクワクしています。 Kyle,どうもありがとう! さて、今回のチャレンジでは私の大好きなチャートタイプの1つである、棒グラフとローソクの組み合わせを題材にしました。 私が初めてこのチャートタイプを知ったのは、かつてこのWOWを立ち上げ、またもう一つの素晴らしいコミュニティイベントであるMakeoverMondayを最近まで主宰していたAndy KriebelさんのVizです。 彼の表現方法を一目見て「すごく良いな」と思い、私も自身が作るVizのいくつかに取り入れるようになりました。 このチャートタイプの作成方法について詳細を知りたい場合は、彼のYoutube動画 を参照ください。 また、チャレンジには私がWOWを通して学んだいくつかのテクニックも盛り込んでいます。 それでは楽しんでください! [EN] The first time I came across WorkoutWednesday was …

#WOW2023 | Week 48 | Can you add candlesticks to bar charts? Read More

2023 Week 47 | Optimise Dashboard Performance

Introduction To ensure that a dashboard you have built is running optimally prior to being released to your users, run a performance check on the dashboard and all queries.  The dashboard inspector 2.0 identifies different types of bottlenecks, such as slow queries and networks, and provides recommendations to improve the performance. It is also a …

2023 Week 47 | Optimise Dashboard Performance Read More

Scroll to Top