Introduction
Hello Everyone! First – I want to say that I hope you and your loved ones are happy, healthy, and safe during this time. It’s amazing to think when I posted my last workout just 4 weeks ago, that the world (at least mine) looked completely different.
I want you to know that you’re all in our thoughts and we are so appreciate and grateful for the continued participation we’ve seen. It’s unbelievably impressive how many of you have taken this opportunity to focus even further on your data skills. You have my admiration.
This week’s challenge is another one that is influenced from my own work. I’ve taken the original ask and distilled it down a bit. My goal being to ensure you each have the opportunity to solve this within a short timebox.
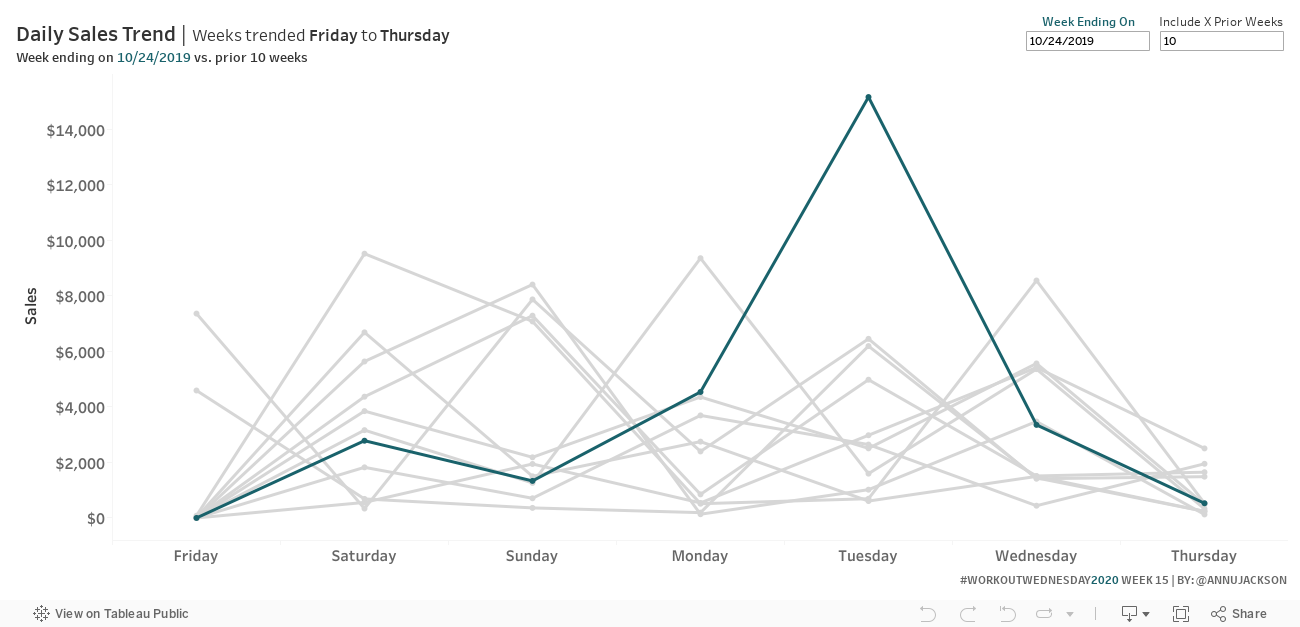
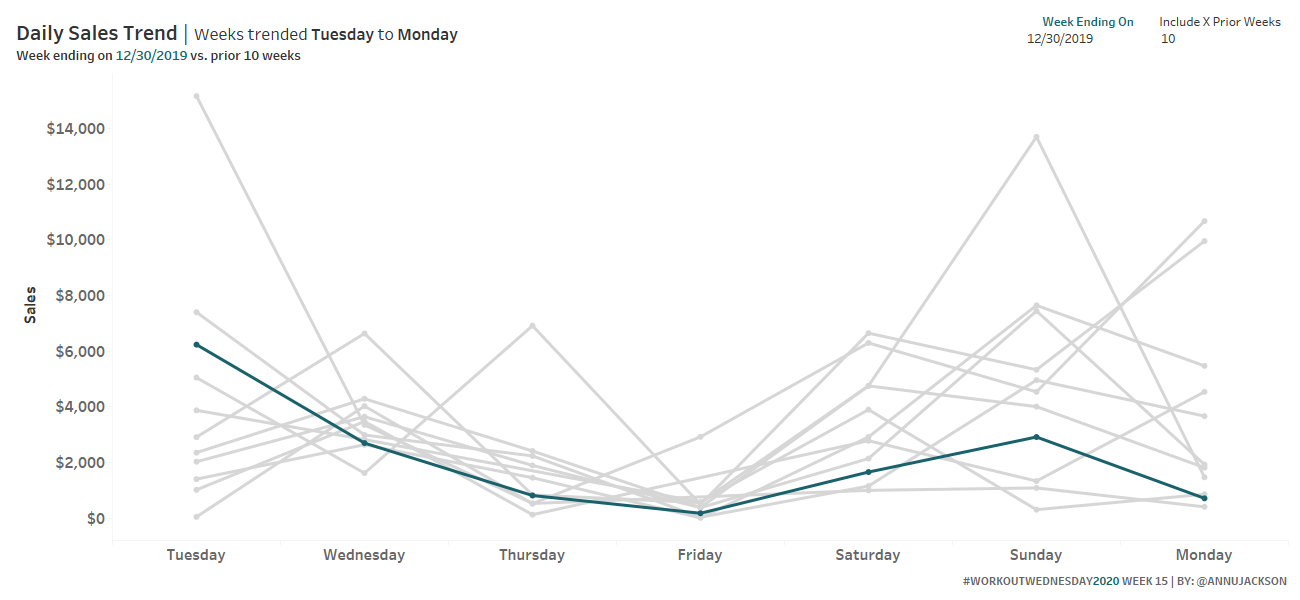
Onto the fun part and the challenge! This week I’d like you to construct a line chart that allows for the start day of a week to dynamically change, based on user input. It also allows the user to determine the number of previous weeks that should be used in comparison.
The genesis of this ask came from the perspective of trying to understand how high and low points change throughout the course of the week and also trying to better understand a chunk of 7 days at a time. In an ever changing climate, the goal was to compare the most common “weeks” to each other, and more specifically, be able to articulate that.
A great example would be to say, “we made this change on Wednesday” and here’s how the next 6 days of the week behaved. It becomes a bit easier to understand the trend if the lines are unbroken by those 7 day periods.
Requirements
- Dashboard Size: 1300px by 700 px
- 1 Sheet (woohoo!)
- Create a line chart that trends in chronological days of the week based on the end date of your target week (ex: Today is Tuesday 4/7/2020, if that’s the end date, I want to trend from Wednesday 4/1/2020 to Tuesday 4/7/2020)
- Line chart will be the daily amount of sales
- There are missing days – make sure when there are missing days that it says “no sales” instead of NULL, the value is shown at 0, and the tooltip still shows the date
- Make sure that the target week is #19626b and the other weeks are #d6d6d6
- Match all other components of the tooltips, title, and any formatting (I am using Tableau Regular for the whole workbook)
Dataset
This week uses the superstore dataset for Tableau 2019.4. You can get it here at data.world
Attribute
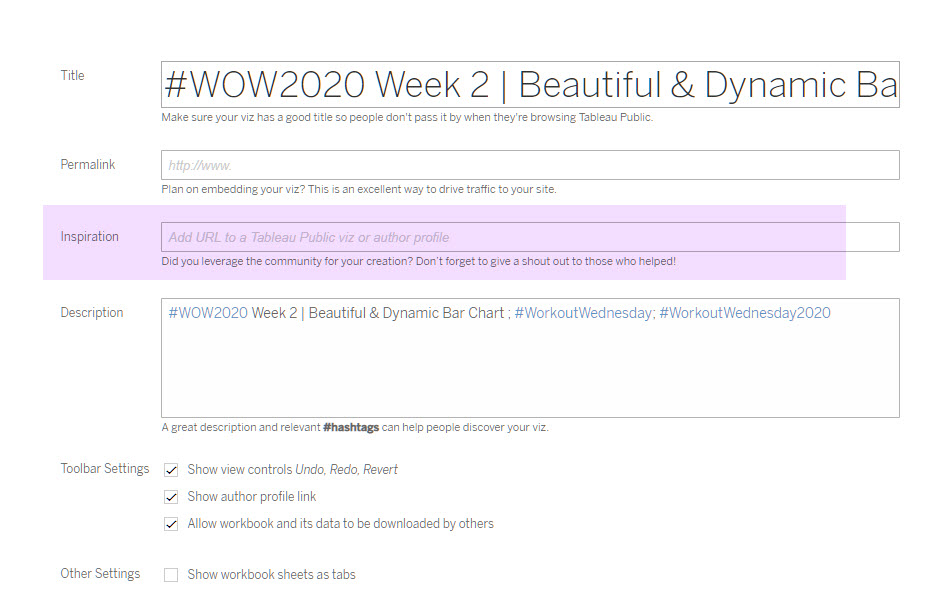
When you publish your solution on Tableau Public make sure to take the time and include a link to the original inspiration. Also include the hashtag #WOW2020 in your description to make it searchable!
Share
After you finish your workout, share on Twitter using the hashtag #WOW2020 and tag @AnnUJackson, @LukeStanke, @_Lorna_Brown and @LosaniMeera
Solution
Interactive