Introduction
Sometimes you want to make fun charts, but life gives you tables. This challenge is another real-life challenge I’ve encountered through Dr. Alicia Bembenek: show a table, but only highlight a subset of the products. An innocent challenge that is actually more difficult than it first appears. –LS.
Be sure to check out the challenge on Tableau Public.
Difficulty: 9/10
Requirements
- Dashboard Size: 800px by 800px
- 1 sheet
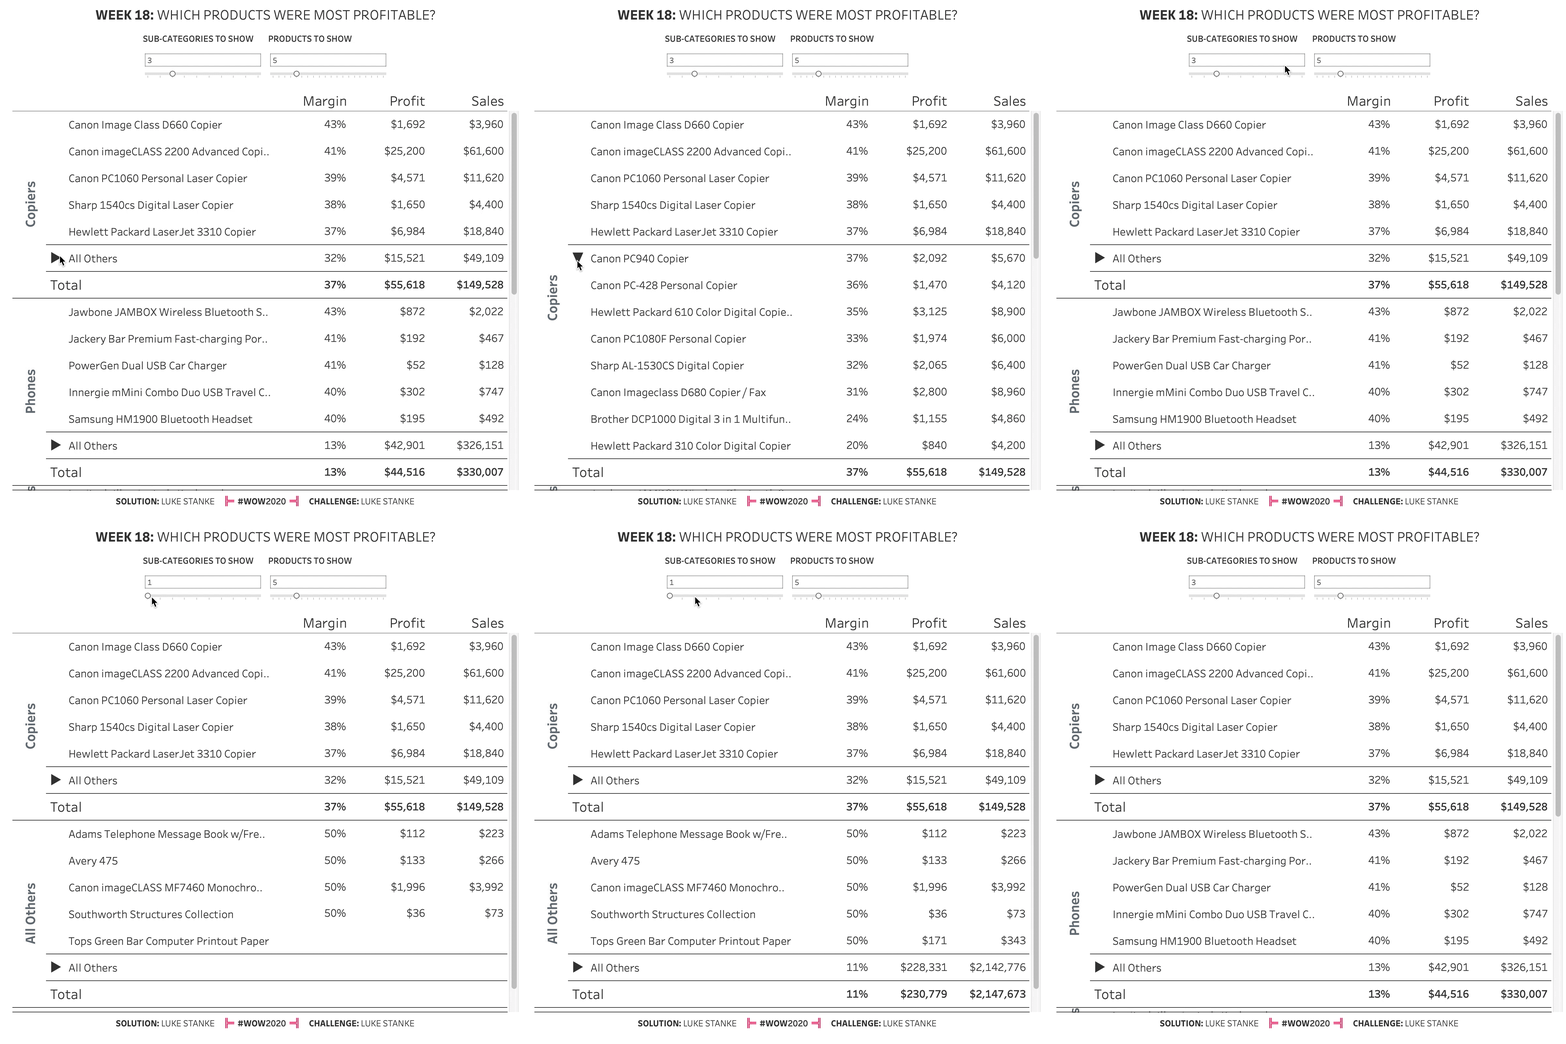
- Use a parameter to show the top N sub-categories by total profit. Set the default to 3. If they are not in the top N, group all other sub-categories together as “All Others”.
- Use a parameter to show the top N products within that sub-category by margin. Set the default to 5. Group all other products within a sub-category together and total “All Others”
- Show margin (SUM(profit)/SUM(Sales)), total profit, and total sales for each value shown
- Use an action to drill into the “All Others” products within a particular sub-category.
- Add totals.
- Match formatting (Text formatting, and row dividers)
Dataset
This week uses the superstore dataset for Tableau 2019.4. You can get it here at data.world
Attribute
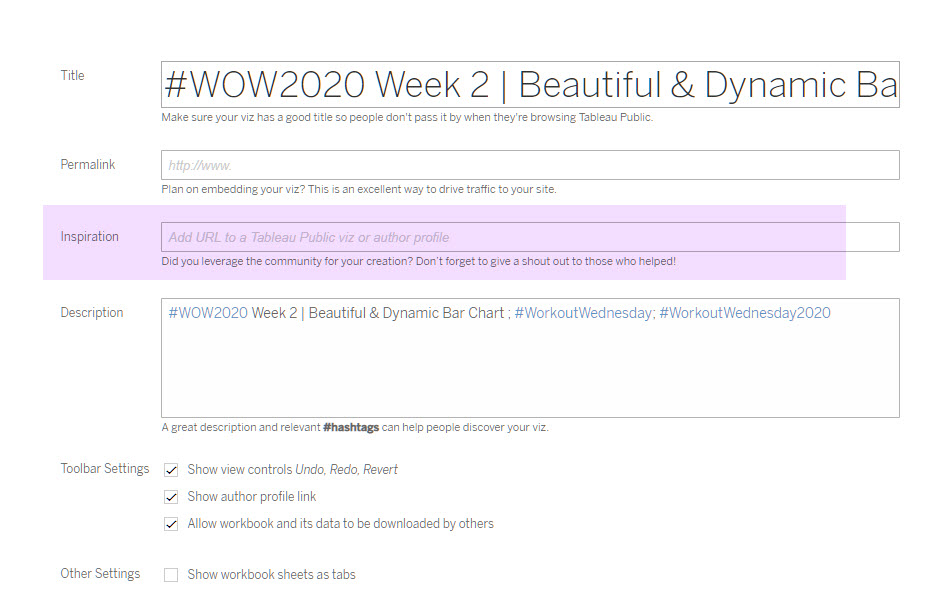
When you publish your solution on Tableau Public make sure to take the time and include a link to the original inspiration. Also include the hashtag #WOW2020 in your description to make it searchable!

Share
After you finish your workout, share on Twitter using the hashtag #WOW2020 and tag @AnnUJackson, @LukeStanke, @_Lorna_Brown and @LosaniMeera
