Introduction
Jami Delagrange is responsible for this week’s Community Workout Wednesday Challenge. Here are all the details in Jami’s own words:
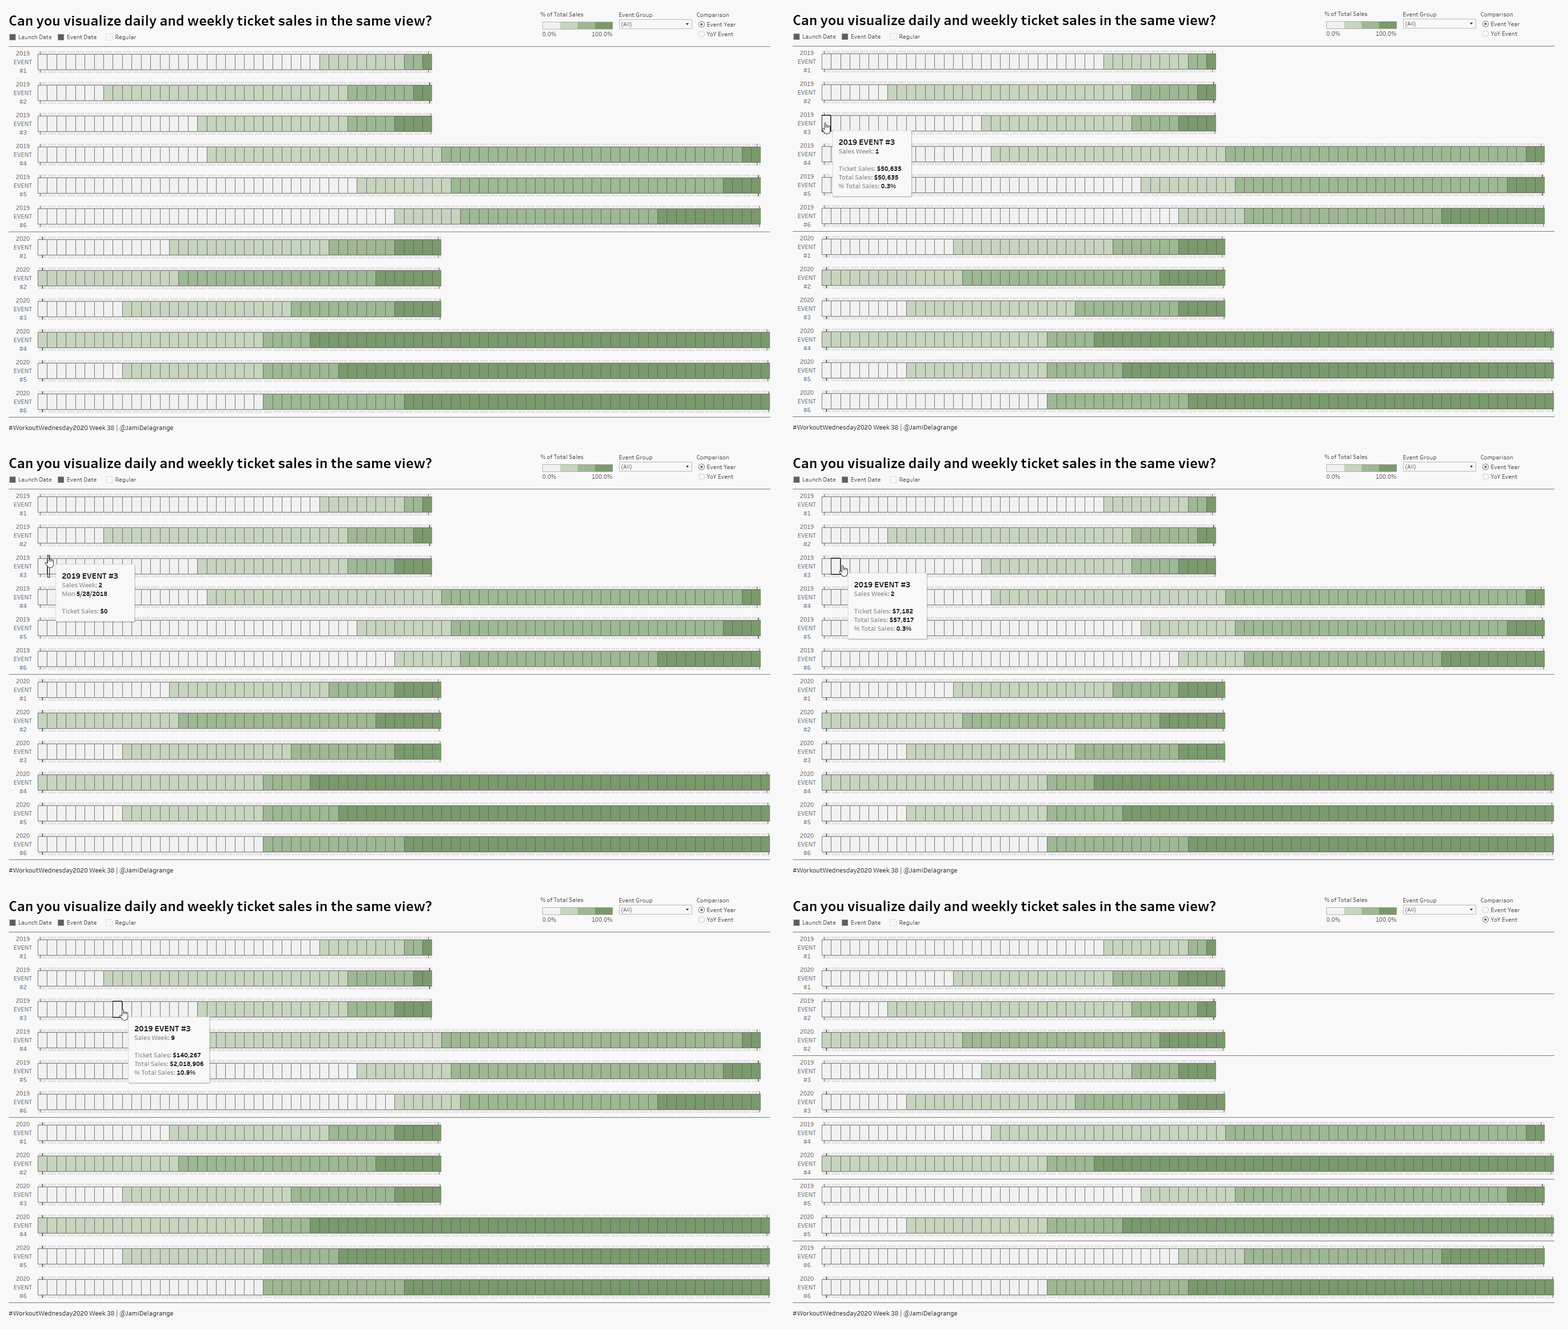
A few months ago, I was working with conference registration data and the event team asked the question, “can we look at daily and weekly registrations in the same view?” The chart below is an adaption of that request using generic event data focused on ticket sales.
The daily view provides a space to highlight specific dates. I am only exposing the launch date and event date in this example, but it’s a great area to display marketing promotions (like early bird discounts, etc.). The weekly view is a quick way to recognize pacing across the event year or YoY event comparison.
This week’s challenge is more intensive from a data modeling perspective and understanding how to manipulate dates; however, an extract file is also provided if you want to jump right into the visualization.
Requirements
- Dashboard Size: 1600 px by 900 px
- # of Sheets – 1
- Create a dual axis chart showing
- Total Daily Ticket Sales
- Total Weekly Ticket Sales
- Set each event to start during the week of the launch date
- Set each event to end during the week of the event date
- Set each week to start on a Monday
- The full 7 days are always available within each week
- Color
- Daily – based on important dates (launch date, event date, regular)
Dataset
Choose your own adventure:
- Build the data model from scratch
- Jump into the visualization
All files in a folder here.
The data is based off an event that happens twice a year. There are 3 events packed into a weekend, with the 3rd event in the set being the big seller.
Example:
- 2018 Event #1 – (small event)
- 2018 Event #2 – (medium event)
- 2018 Event #3 – (large/massive event)
— pattern repeats — - 2018 Event #4 – (small event)
- 2018 Event #5 – (medium event)
- 2018 Event #6 – (large/massive event)
Attribute
When you publish your solution on Tableau Public make sure to take the time and include a link to the original inspiration. Also include the hashtag #WOW2020 in your description to make it searchable!

Share
After you finish your workout, share on Twitter using the hashtag #WOW2020 and tag @AnnUJackson, @LukeStanke, @_Lorna_Brown, @HipsterVizNinja and @JamiDelagrange

Hi,
I’d like to challenge WoW2020 Week 38, but I can’t do download data files. Maybe, the URL link is invalided.