
Introduction
Sam Epley (100% completion club #WOW2020) is responsible for this week’s Workout Wednesday Challenge. Here are all the details in Sam’s own words:
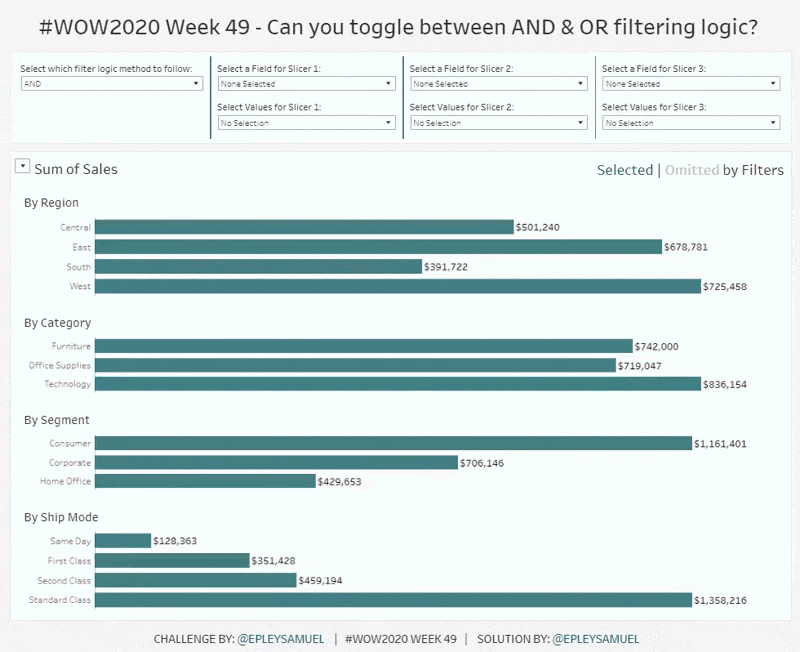
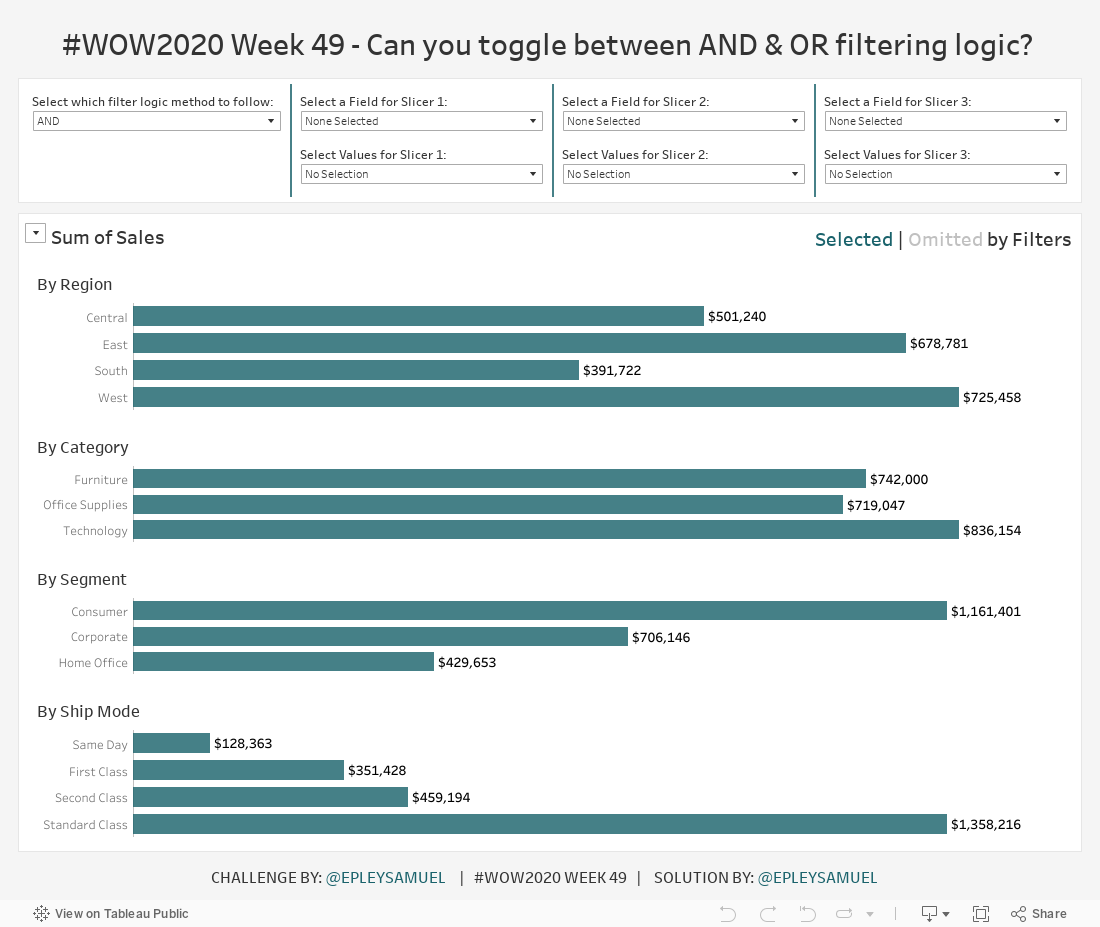
Several months ago, I was working with a client who wanted to provide their end user with some pretty clever functionality I’d never seen before. They wanted their user to be able to toggle between Tableau’s default filter logic (what we referred to as AND logic) and more flexible filter logic (what we referred to as OR logic). AND logic returns records only that satisfy all selected conditions (ex: Furniture AND East Region AND First Class Ship Mode). OR logic returns records that meet one or more of the selected conditions (ex: Furniture OR East Region OR First Class Ship Mode).
Working with several of my DataDrive colleagues and Twin Cities Tableau User Group #DataFam peers, we struggled to develop a workable solution. That all changed when Tableau Desktop 2020.2 was released and new functionality became available that made this type of request possible.
So that’s the challenge for this week’s #WOW2020 exercise: build a dashboard that leverages this different approach to filter logic.
Requirements
- Dashboard size: 1100px by 900px
- # of Sheets – 4
- No floating objects: tiled objects and dashboard containers only
- Build functionality that allows a user to toggle between AND filter logic (default) and OR filter logic
- Create three slicers that contain the following values:
- None Selected (default)
- Location
- Region
- State
- Product
- Category
- Sub-Category
- Customer
- Segment
- Shipping
- Ship Mode
- Each of these three slicers feed values
- Create four bar charts that display selected vs. omitted field values for the following:
- Region
- Category
- Segment
- Ship Mode
- End user should be able to toggle through three different metrics:
- Sales
- Quantity
- Orders (based on Order ID)
- For “selected” records, use dark green #19626b (80% opacity in bar charts)
- For “omitted”, use light grey #dddddd (80% opacity in bar charts)
- Use the following for the slicers, Unicode character 255A = ╚
- When a user clicks on the bar charts, ensure that the bar does not remain highlighted
- Ensure that dropdown menus have an apply button
- Match tooltips and all other formatting
Dataset
This week uses the superstore dataset shipped in Tableau 2020.3, you can download it here at data.world
Attribute
When you publish your solution on Tableau Public make sure to take the time and include a link to the original inspiration. Also include the hashtag #WOW2020 in your description to make it searchable!
Share
After you finish your workout, share on Twitter using the hashtag #WOW2020 and tag @EpleySamuel, @AnnUJackson, @LukeStanke, @_Lorna_Brown and @HipsterVizNinja
Solution
Interactive
Hello, the link for data does not work. I cannot download it…
Once again, you ll need an instance of this bar chart for each of the measures Sales, Profit, Margin Customers . On the dashboard, you need to use a vertical layout container, and place all the sheets in order underneath each other, so you have KPI, bar, KPI, bar etc.
Hi, I found it to be very interesting. I am thinking about how complex it would be when we consider AND OR options at the same time. In salesforce, we use filter operations like below (filter 1 OR 2 OR 3) AND 4 AND 5