Introduction
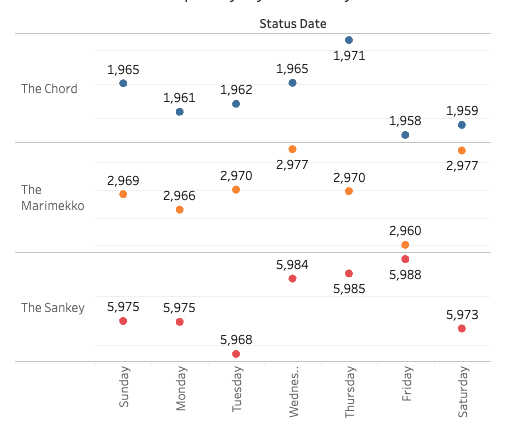
This week we return to another business-specific challenge. This team we will explore hospitality data. The goal of this challenge is to determine what the average occupancy is by day at three different properties.
The challenge of this data is that you’ll only ever know when customers check-in or check-out. Not the actual total on a given day. You’ll then have to do a secondary calculation to determine the average by weekday.
The data you will use for this challenge was modified from the Real World Fake Data project by Mark Bradbourne.
Requirements
- Dashboard Size: 500px by 500px
- 1 of Sheet
- Calculate occupancy by adding by all children and adults with a reservation status that is not no show.
- Filter the max date in the data set
- Find a way to get the occupancy for any given day. Then take the week day average by property.
- Match the formatting
- Bonus: return just 21 marks.
Dataset
Get the Hospitality Tableau Extract from this Google Drive folder.
Attribute
When you publish your solution on Tableau Public make sure to take the time and include a link to the original inspiration. Also include the hashtag #WOW2022 in your description to make it searchable!

Share
After you finish your workout, share on Twitter using the hashtag #WOW2021 and tag @LukeStanke, @_Lorna_Brown, @_hughej, @YetterDataViz and @HipsterVizNinja

I used Tableau Prep to calculate the “everyday occupancy” by adding more rows 😭。Using TC to calculate the “everyday occupancy” is amazing, thanks so much!
This week’s challenge looks easy, but really need a lot Tableau knowledge to make it.