Introduction
Welcome to community month for 2023. Each year since 2018 we’ve hosted a community month–where we invite different people from the Tableau Community. This year I wanted to invite someone who has been a prolific supporter of the data visualization community but hasn’t been recognized by Tableau as an Ambassador or Visionary for his near-decade effort in progressing community efforts.
This person has supported Sports Viz Sunday and Workout Wednesday in the past. This person is Spencer Baucke. Spencer has 15 viz-of-the-days, pioneered Workout Wednesday – Power BI Edition, and co-led Sports Viz Sunday for four years.
In this week’s challenge, Spencer and I teamed up to create a viz around the average time of a Major League Baseball outing.
For those not familar, Baseball is a popular team sport in which two teams take turns batting and fielding, aiming to score runs by hitting a ball and running around a series of bases to reach home plate. Each team gets 9 turns to score runs–these turns are called innings. There are no ties–so if two teams are tied after 9 innings they keep playing 1 inning at a time until there is a winner. For more details, check out wikipedia.
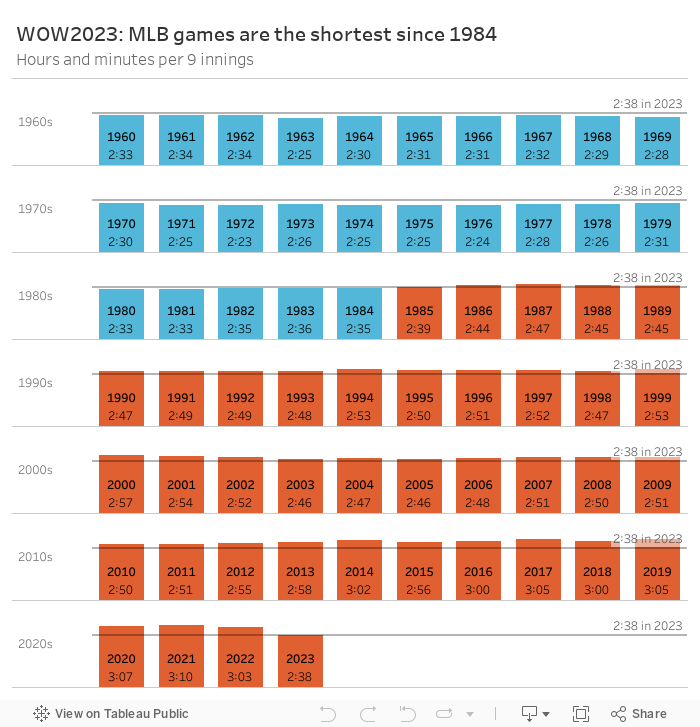
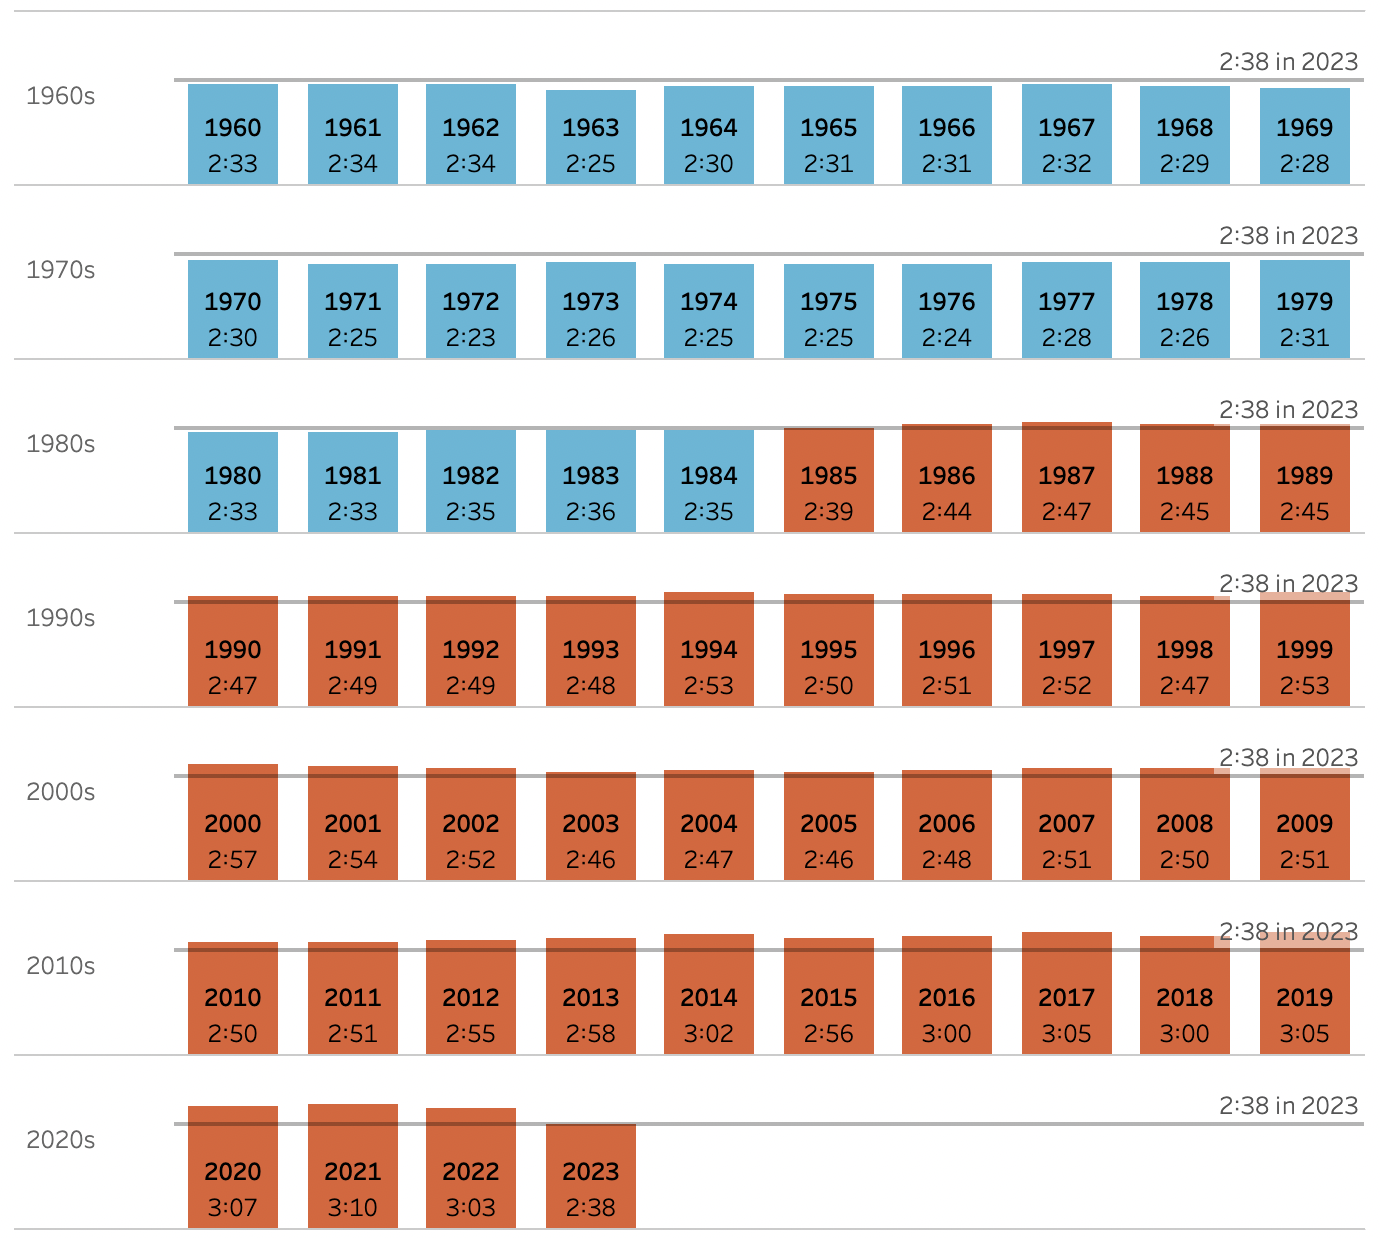
In 2023, baseball overhauled its rules to speed up the game. This visualization attempts to show how much faster the game is in 2023 versus every year since 1960.
Requirements
- Dashboard Size: 700 x 700px
- 1 sheet
- Filter to years 1960 and beyond
- Convert your [Time/9I] field into total minutes (The field is average game length per 9 innings)
- Create a bar chart of average minutes per 9 innings for each year.
- Group the bars by decade.
- Place labels at the bottom of the bars showing the year and the average time per 9 innings.
- Create a reference line that matches the average game time for 2023. Hard code the text.
- Use the Lightning Default palette. If the time is equal to or greater than 2023, color it red, if it is less than the average game time in 2023 then color it blue.
- No tooltips needed
- Match the formatting
- IMPORTANT: Your 2023 may be different than the values in this based on the day you’ve downloaded the data. To confirm, check the values of your own data source!
- ADVANCED: No level-of-detail calculations
Dataset
This week’s data comes from baseball-reference.com. Go to this page, select Share & Export, then export it as a csv.
The link: https://www.baseball-reference.com/leagues/majors/misc.shtml
Attribute
When you publish your solution on Tableau Public make sure to take the time and include a link to the original inspiration. Also include the hashtag #WOW2023 in your description to make it searchable!

Share
After you finish your workout, share on Twitter and/or LinkedIn using the hashtag #WOW2023 #Tableau and tag @WorkoutWednsday
Solution
Interactive