Introduction
This week we have a special guest, Venkatesh Iyer. Venkatesh is currently a Senior Analytics Consultant at phData–and has recently written a number of blogs that bring novel solutions to the community, including:
- How to improve the performance of count distinct
- How to Create a Drill Down Table in Tableau
- How to paginate in Tableau
- How to replace blank and zero/null values in Tableau
Venkatesh brings creative, performant solutions to everyday problems in Tableau, so I invited him to share a challenge. And I think everyone will enjoy this week’s challenge
Requirements
Basics
- Dashboard Size: 1000 x 800px
- At least 2 sheets (can be done with 3 as well)
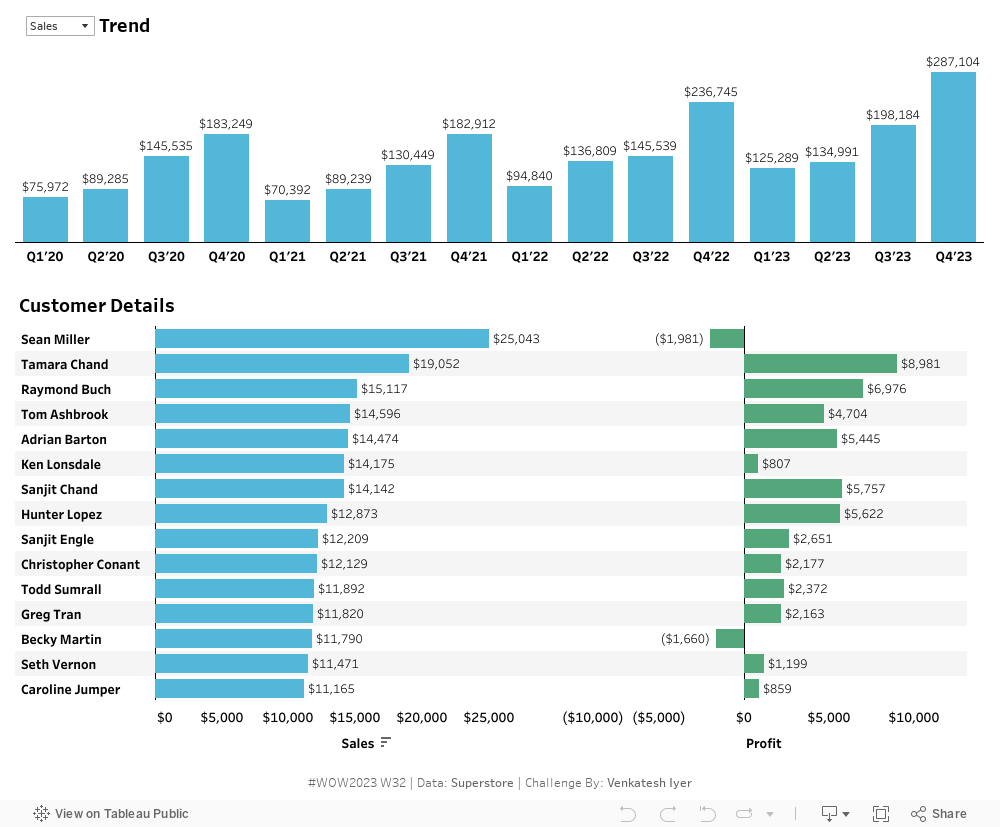
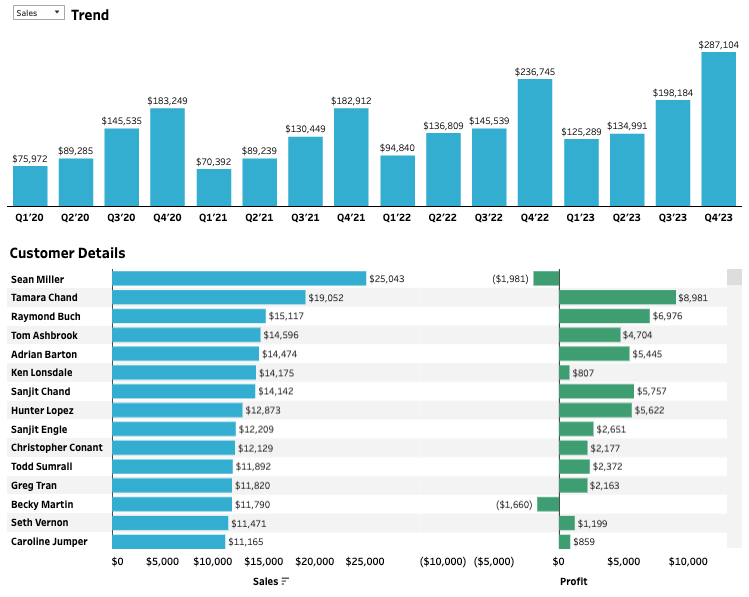
Quarterly Bar Chart
- Create a bar chart that shows either Sales or Profit (depending on what is selected) by quarter of Order Date
- Add labels on top of the bars
- The color of the bars should dynamically update depending on whether Sales or Profit is selected
Customer Bar Chart
- Show Sales and Profit by Customer Name
- Make sure the Profit and Sales bars should be different colors match the quarterly bar chart (depending on the measure selected)
When you select a bar on the Customer Bar Chart, the Quarterly Bar Chart should…
- Update to the measure that is selected
- Filter to the customer selected
- show 0s for quarters where customer have no sales/orders.
- Update the header to show the customer name above the Quarterly Bar Chart.
Additionally..
- Match the formatting
Dataset
This week uses the latest superstore dataset. You can find it here on Data.World
Attribute
When you publish your solution on Tableau Public make sure to take the time and include a link to the original inspiration. Also include the hashtag #WOW2023 in your description to make it searchable!

Share
After you finish your workout, share on Twitter and/or LinkedIn using the hashtag #WOW2023 #Tableau and tag @WorkoutWednsday
Solution
Interactive