Introduction
I’m always on the lookout for ideas for challenges. Typically I’ll see something someone has done and want to know how they did it and whether I can craft it into a WOW challenge.
When my colleague, Sam Parsons, demonstrated the concept of an interactive Viz In Tooltip (VIT) at Tableau Conference this year, it was truly a mic-drop moment and I knew I needed to understand what he’d done.
So I’ve poured over his workbook from TC23 (see the ‘Interactive map layer tooltip’ tab in this workbook), and managed to build a challenge based on the concepts.
I’ve done my best to simplify the challenge – unlike Sam, I have chosen not to use map layers to build a single sheet with all the VIT information, or used any other tools other than Tableau to display the VIT. Instead I have used multiple sheets to make the VIT ‘card’, but feel free to use map layers if you wish. Note – when referencing multiple sheets in a tooltip, give consideration to the maxwidth and maxheight properties and the alignment properties to aid the layout.
I appreciate this may be higher up the difficulty scale than some challenges, but once complete it provides a great example to have in your toolkit. There is absolutely no shame in using Sam’s workbook as a guide if need be (I mean I had to!). I’ve also tried to include some additional hints in the requirements below to help you on your way.
Requirements
- Dashboard 800 x 800
- As many sheets as you wish (I used 5)
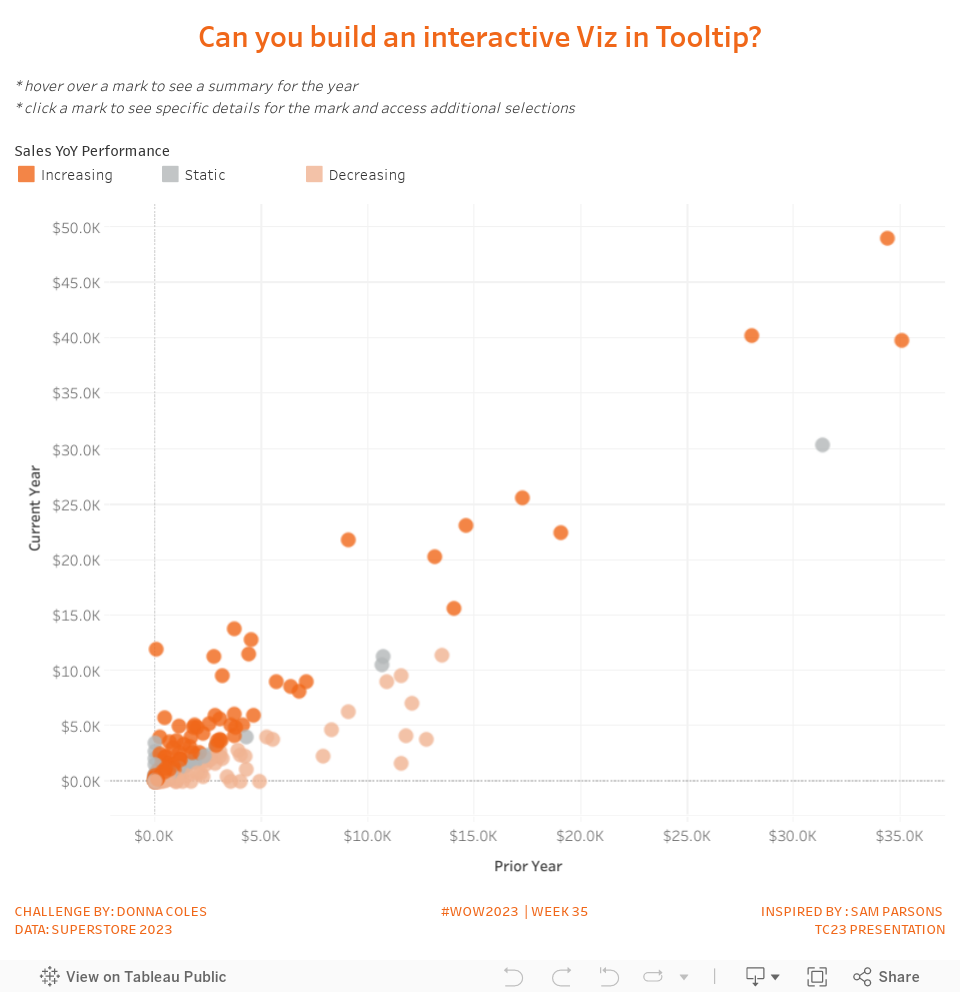
- Build a scatter plot that plots the Sales for the current year (2023) against the Sales for the prior year (2022).
- A circle should display for each Category > Sub-Category > Manufacturer combination
- Colour each circle based on the % change in Sales
- If the % change > 110% then Sales are Increasing (#f06719)
- If the % change < 90% then Sales are Decreasing (#f0b392)
- Otherwise Sales are Static (#b3b7b8)
- On hover of a circle on the scatter plot, a Viz in Tooltip ‘card’ should display.
- By default the initial information displayed should be related to the total sales for the current year across all manufacturers (hint – the VIT is not being filtered based on the details associated to the mark that you’ve hovered on)
- The card ‘title’ should initially indicate that all manufacturers are included and indicate the number of distinct manufacturers and sub-categories included.
- A KPI/BAN should display the total Sales value for the current year.
- Display the actual YoY% change value along with the total Sales for the prior year.
- The background colour should be based on the % change bandings described above
- Build a bar chart that displays Sales by month for current year.
- Indicate the monthly sales for the prior year by a horizontal line on each bar
- Colour the bars based on the % change in Sales as described above
- Display a Category > Sub-Category > Manufacturer > Current Mark ‘hierarchy’ associated to the circle mark being hovered on.
- On click/select of a circle on the scatter plot, the Viz In Tooltip ‘card’ should update to reflect information related to the selected mark only (hint – you need to capture the associated Category, Sub-Category and Manufacturer into sets)
- If you click on the Category or Sub-Category or Manufacturer or Current Mark text displayed at the bottom of the Viz In Tooltip card, the information in the card should update to reflect the level of the hierarchy you selected
- Eg if you originally clicked on a mark related to the Manufacturer GBC associated to the Binders Sub-Category and Office Supplies Category, clicking on Binders should then display the current year sales for all Binders (and multiple circles on the scatterplot will be highlighted)
- hint – this functionality is making use of the Allow Selection by Category option which is part of the Tooltip dialog.
Dataset
This challenge uses the Superstore TDS file shipped with 2023.2 (which contains Manufacturer). It can be accessed from here.
Attribute
When you publish your solution on Tableau Public make sure to take the time and include a link to the original inspiration. Also include the hashtag #WOW2023 in your description to make it searchable!

Share
After you finish your workout, share on Twitter and/or LinkedIn using the hashtag #WOW2023 #Tableau and tag @WorkoutWednsday
Solution
Interactive