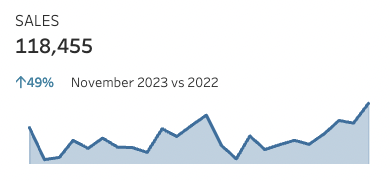
Show the percent change from the same month the prior year.
Include a sparkline that has the last 24 full months–this means no December.
When you hover over a month in the sparkline, the kpi should show the sales for that month–and the correct percentage comparison.
Include a dynamic label for month on the hover effect.
Match the tooltips.
Dataset
Use the Superstore 2023 data. You can get it here.
Attribute
When you publish your solution on Tableau Public make sure to take the time and include a link to the original inspiration. Also include the hashtag #WOW2023 in your description to make it searchable!