Introduction
I’ve always liked tracking my personal finances, partly out of necessity (I was a freelance musician for nearly a decade and I needed to keep track of *every* expense). Even before I got into data, I appreciated seeing my personal finances visualized cleanly so I could answer questions like ‘Did I spend too much last month?’
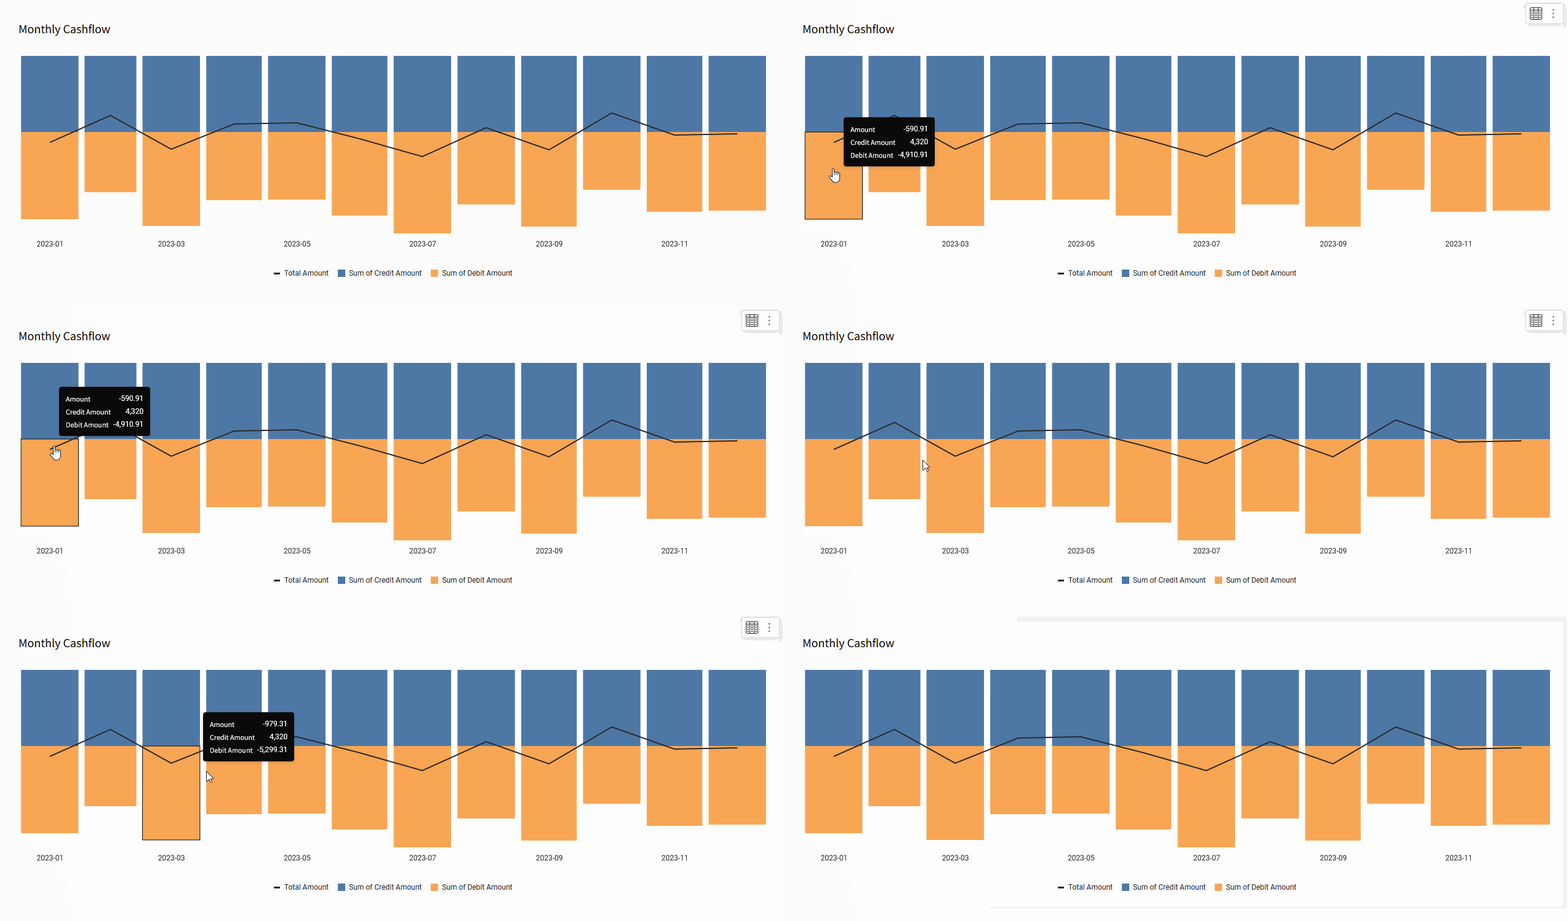
This week, I’m leading you through creating a cashflow visualization, similar to what you might find in your favorite personal finance app!
Need access to Sigma?
Note: You will only have view access to WOW Workbooks, Folders, and Workspaces, not edit access. Please create your WOW Workbooks under “My Documents.” We suggest creating a folder to organize all your workbooks.
Requirements
- Get your source data
- Add Element > Tables and Datasets > Workspaces > Workout Wednesday > 2024 > 2024W27 – Can you make a Cashflow Chart? > Personal Transactions > Transactions
- Create some extra columns in your source data
- Credit or Debit
- If the amount is greater than 0, it’s Credit, otherwise, it’s debit
- Credit Amount
- If the record is a Credit, use the amount, otherwise, leave it null
- Debit Amount
- If the record is a Debit, use the amount, otherwise, leave it null
- Credit or Debit
- Create a combo chart
- Create new visualization element
- Set the type to ‘Combo’
- Change the display to ‘Stacked’ (just beneath the dropdown for visualizations, you’ll see the two bar images)
- Truncate the date to the month and drag it to the X-Axis
- Drag the following fields to the Y-axis in this order:
- Amount (rename to Total Amount)
- Credit Amount
- Debit Amount
- Change your Y-axis fields to the appropriate shape:
- Total Amount: Line
- Credit Amount: Bar
- Debit Amount: Bar
- Update the colors of your bars, choose whatever you like, but I prefer:
- Total Amount: Black
- Credit Amount: Blue
- Debit Amount: Orange
- Remove all your X-axis and Y-axis fields from the tooltip (right click on each and uncheck ‘Show in Tooltip’ near the top of the menu)
- Add each of the columns in the Y-axis to the tooltip, but rename them so they don’t auto-increment:
- Amount
- Credit Amount
- Debit Amount
- Format your chart
- Title: Monthly Cashflow
- X-Axis
- Change the Scale type to ‘Time’
- Hide grid lines
- Y-Axis
- Uncheck ‘Axis Labels’
- Uncheck Show zero guideline
- Hide Grid Lines
- Legend
- Move to the bottom of the visualization
- Move to the bottom of the visualization
Dataset
Workspaces > Workout Wednesday > 2024 > 2024W27 – Can you make a Cashflow Chart? > Personal
Share
After you finish your workout, share on LinkedIn, Sigma’s Community page, (or Twitter) using the hashtags #WOW2024 and #SigmaComputing, and tag Ashley Bennett, Eric Heidbreder, Katrina Menne, and Michal Shaffer!
Create an interactive, sharable version of your solution here.
Also, make sure to fill out the Submission Tracker so that we can count you as a participant this week to track our participation throughout the year.
Solution
Coming Soon!
