Introduction
Welcome to Week 29!
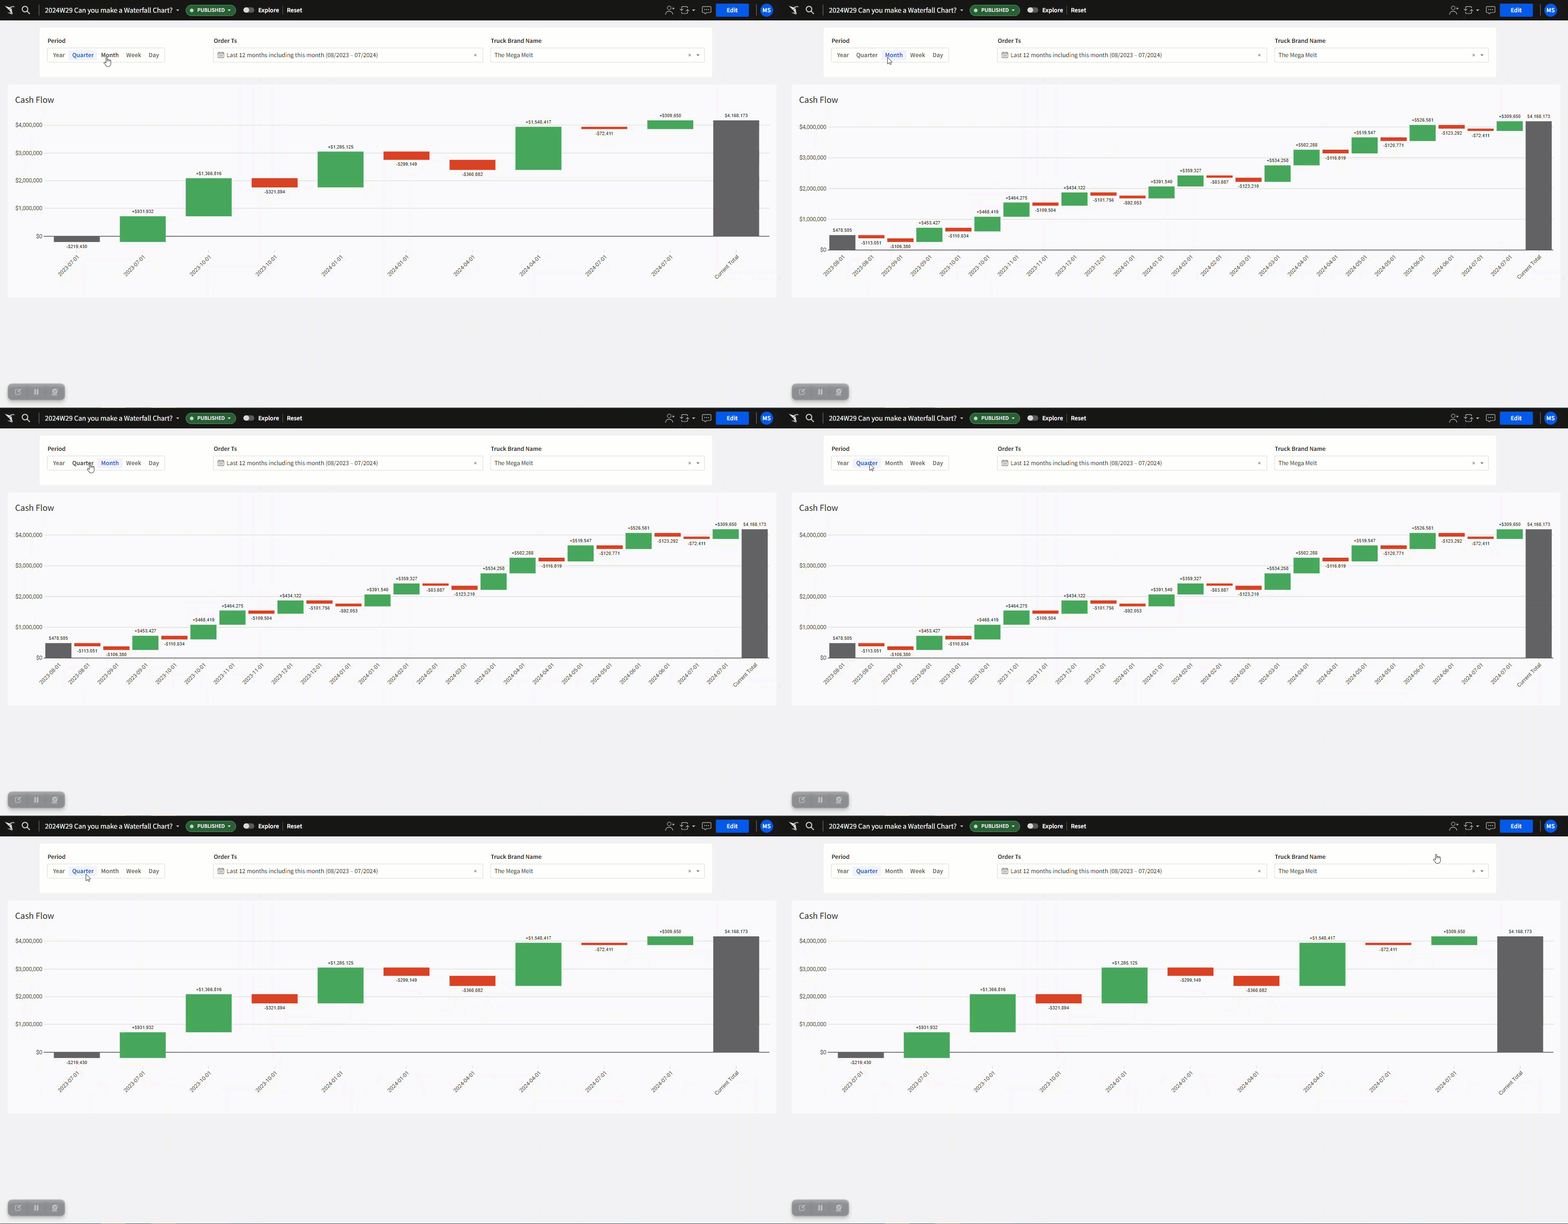
When dealing with time series data, sometimes we want to see how the data changes from period to period, specifically how it increases and decreases. Enter, the waterfall chart. Waterfall charts are a great way to see the journey of a value from start to end, and to see how positive and negative changes effected it along the way.
Let’s look at our Food Truck cost and sales data to build our first waterfall chart!
Have fun!
Need access to Sigma?
Note: You will only have view access to WOW Workbooks, Folders, and Workspaces, not edit access. Please create your WOW Workbooks under “My Documents.” We suggest creating a folder to organize all your workbooks.

Requirements
Adding Data
- Add data table element from TASTY_BYTES_FOOD_TRUCKS schema
- Sigma Sample Database > Retail > TASTY_BYTES_FOOD_TRUCKS
- FCT_DAILY_ORDER_PROFIT – has daily order information
- Group the FCT_DAILY_ORDER_PROFIT table:
- First grouping level – Order Date
- Calculations
- Total Sales
- Total Cogs – make this column negative! (-sum([cogs])
- Create Two Child tables of the FCT_DAILY_ORDER_PROFIT table
- Rename one table to ‘Sales’ and delete the Total Cogs column
- Rename the other table to ‘COGs’ and delete the Total Sales column
- Create a new table as a Union of the Sales and COGs tables
- Match the order date columns
- Match the Total Sales column to the Total COGs column
- Rename the Sales/Cogs column to Cash Flow Value
- Create a filter on the Order Ts column of the FCT_DAILY_ORDER_PROFIT table. Default to the last 12 months
- Create filter on the Truck Brand Name of the FCT_DAILY_ORDER_PROFIT table. Default to The Mega Melt.
- Create a segmented control using ‘create list from preset – date parts’ option.
- Delete the values for hour, minute, second.
- Set the control value to ‘period’ and rename the control
- Change the Grouped Date in the FCT_DAILY_ORDER_PROFIT table to group by the segmented control selection.
- Rename the Grouped Date column to ‘Order Period’
- Default the segmented control to Month
- Create a waterfall chart as a child element of the Unioned table
- Put the Order Period column in the X axis
- Put the Cash Flow Value in the Y axis
- Make sure the Y values are not aggregated
- Rename the chart to ‘Cash Flow’
- Format the Chart to show the data labels
- Move your source tables (including the union) to a hidden data tab
- Move your controls to the top of the page
- Don’t forget to share your solution
Dataset
Sigma Sample Database > Retail > TASTY_BYTES_FOOD_TRUCKS
Share
After you finish your workout, share on LinkedIn, Sigma’s Community page, (or Twitter) using the hashtags #WOW2024 and #SigmaComputing, and tag Ashley Bennett, Eric Heidbreder, Katrina Menne, and Michal Shaffer!
Create an interactive, sharable version of your solution here.
Also, make sure to fill out the Submission Tracker so that we can count you as a participant this week to track our participation throughout the year.