Introduction
This week’s challenge was inspired by a lively discussion I was a part of, covering what date calculations a data analyst should or should not know. We’ve already covered several common ones, such as the current time period vs the prior time period. So this week, I wanted to add another to the list: identifying partial months!
Have fun!
-Katrina
Need access to Sigma?
Note: You will only have view access to WOW Workbooks, Folders, and Workspaces, not edit access. Please create your WOW Workbooks under “My Documents.” We suggest creating a folder to organize all your workbooks.

Requirements
- Add a data table element from the Plugs Electronic Folder
- Sigma Sample Database > Retail > Plugs Electronic > Plugs Electronics Hands On Lab
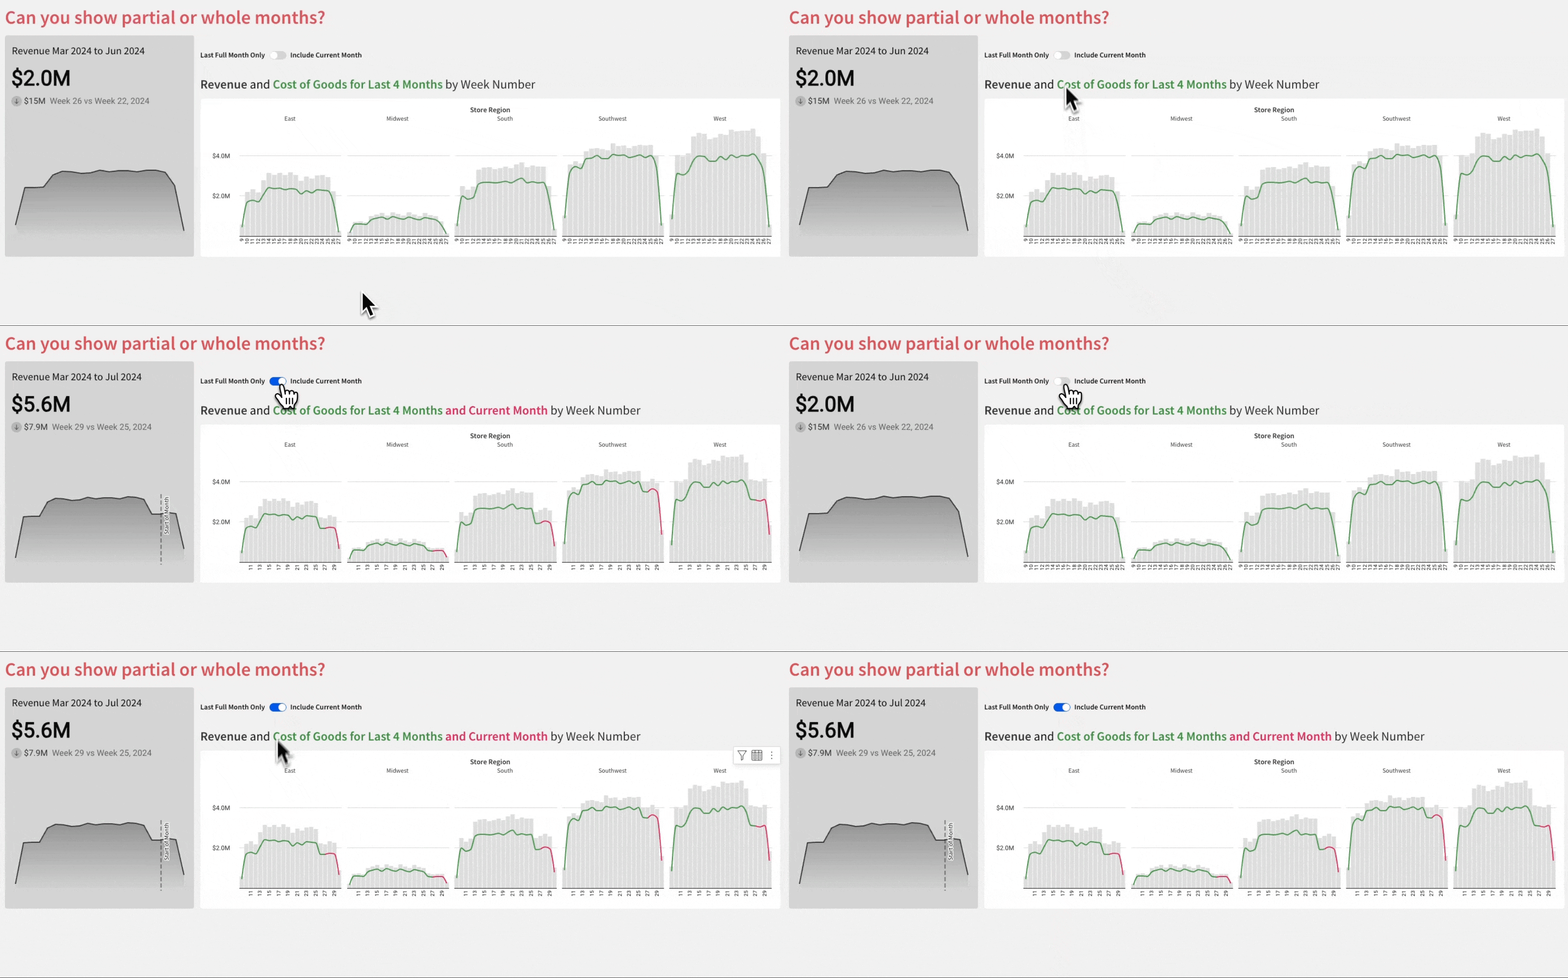
- Create a Switch to control if the data contains the current month or not
- Create a KPI showing Revenue by week compared to this week last month.
- Include a dynamic title based on the date range
- Include an indicator of the start of the month on the trend line
- Match other formatting
- Create a bar and line chart showing the Revenue and Cost of Goods by Week Number and Region for the last 4 months and potentially the current month
- Have the lines be colored differently:
- Here are the colors I used; you can choose different ones
- Revenue: DDDDDD
- Current Month COGs: E91E63
- Other Months COGs: 388E3C
- Match other formatting
- Add challenge title
- Revenue = Sum([Price] * [Quantity])
- COGS = Sum([Cost] * [Quantity])
Dataset
Sigma Sample Database > Retail > Plugs Electronic > Plugs Electronics Hands On Lab
Share
After you finish your workout, share on LinkedIn, Sigma’s Community page, (or Twitter) using the hashtags #WOW2024 and #SigmaComputing, and tag Ashley Bennett, Eric Heidbreder, Katrina Menne, and Michal Shaffer!
Create an interactive, sharable version of your solution here.
Also, make sure to fill out the Submission Tracker so that we can count you as a participant this week to track our participation throughout the year.
Solution
- Create a “Show partial or whole month” switch control element.
- In the parent table element, create a formula for if the date is within the selected time frame.
- If([New-Control], True, (InDateRange([Date], “current”, “month”)))
- In the same table, create a week of date calculation
- DatePart(“week”, [Date])
- For the KPI
- Create a child KPI off of the parent table element
- Put Revenue as the value
- Week of Date as the timeline
- Comparison is “This week last month”
- Add a reference line on the x-axis with the custom formula of
- If([New-Control], DateTrunc(“month”, Today()))
- Change the title to be dynamic with the Min & Max Date formatted to Month and year
- For Combo Chart
- Add a combo chart with the Week of Date as the X-Axis
- On the Y-Axis add three calculations:
- Revenue (either the Metric or sum([Revenue])
- Current Month COG
- If(InDateRange([PLUGS_ELECTRONICS_HANDS_ON_LAB_DATA/Date], “current”, “month”), [Metrics/COGS])
- Other Months COG
- If(Not (InDateRange([PLUGS_ELECTRONICS_HANDS_ON_LAB_DATA/Date], “current”, “month”)), [Metrics/COGS])
- Display Revenue as bars and COGS as lines
- Color each measure separately
- Trellis the Combo Chart by Store Region