Introduction
I’ve always appreciated when developers take the time to incorporate images into their visualizations, whether it’s as simple as adding an up arrow / down arrow to denote positive or negative trends, or going all the way to showing a business’s/team’s logo when referring to them in a table.
This week, I wanted to lead you through the process of how to render image links in a table in Sigma.
Need access to Sigma?
Note: You will only have view access to WOW Workbooks, Folders, and Workspaces, not edit access. Please create your WOW Workbooks under “My Documents.” We suggest creating a folder to organize all your workbooks.
Requirements
- Get your source data, add it into a ‘Source’ tab
- Tables and Datasets > Workspaces > Workout Wednesday > 2024W31 – Can you set Image Links? > NHL 2023-2024 Regular Season > Team
- Set up your image link column in your source table (Team)
- Add a new column, you can call it Team Image
- Your goal is to split up this link (https://a.espncdn.com/combiner/i?img=/i/teamlogos/nhl/500/ana.png&h=50&w=50) into a few different parts and inject the ‘Team’ column into the link.
- You’re going to use a Concat Function to do this, with the following inputs as parameters.
- Param 1: https://a.espncdn.com/combiner/i?img=/i/teamlogos/nhl/500/
- Param 2: Lower([Team])
- Param 3: “.png&h=50&w=50”
- You can leave this as it is for now, we will set the images up in our next step
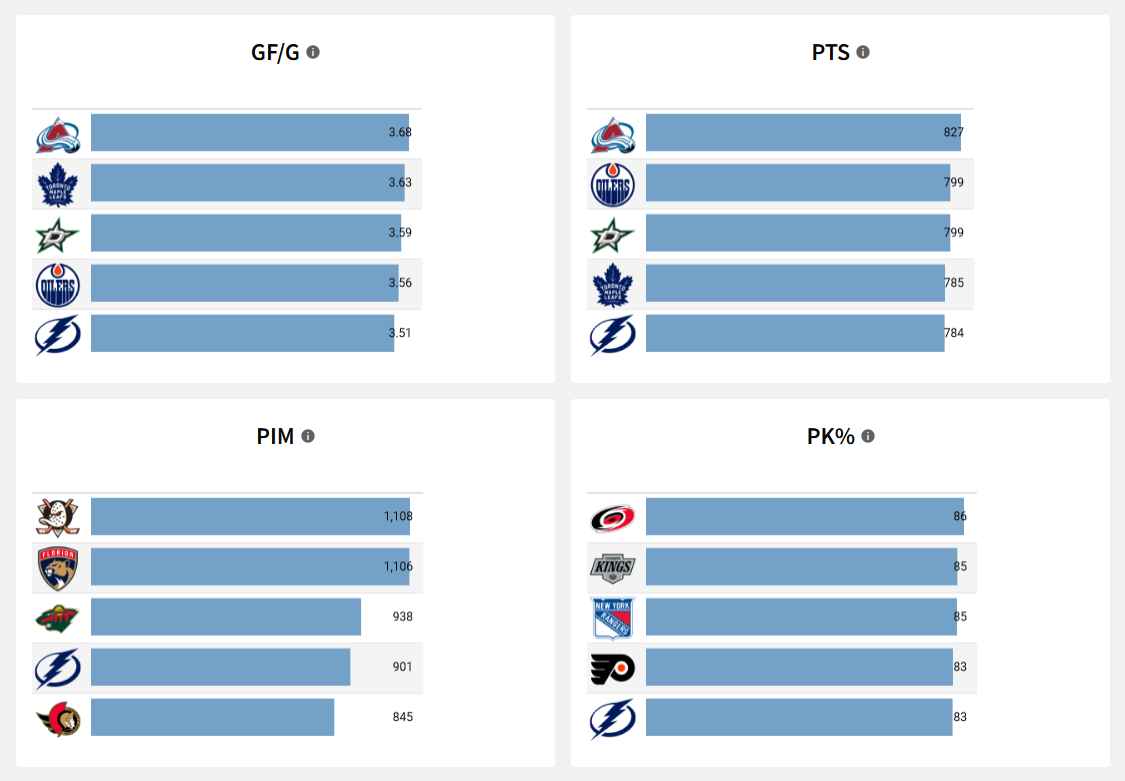
- Create your tables to show the top 5 teams in different categories (I will explain one, and you can duplicate for as many as you’d like)
- Create a new tab called ‘Visualization’
- Create a new table element, use the ‘Team’ table in your ‘Source’ tab as your table source
- Keep only the ‘Team Image’ and ‘GF/G’ columns
- Right click on the ‘Team Image’ column and select Transform > Set Image
- Change ‘Image Sizing’ to ‘Original’
- Note that if you wanted to, you could resize it to be larger or smaller than the original, but it will likely become blurry.
- Hit Save
- Right click on ‘GF/G’
- Sort Descending
- Filter
- Change filter type to ‘Top N’ and set the value to 5
- Select ‘Conditional Formatting’, and then select Data Bars
- Set the positive value to a blue, and set the negative value to orange
- Format your table element
- Title
- Set the title to Bold, 24, and Centered
- Add description “Goals For per Game” and set it to display as a Tooltip
- Table Components
- Uncheck ‘Show summary bar’
- Table Style
- Set Table Style Presets to Presentation
- Cell spacing – Large
- Grid Lines – Horizontal Grid
- Check Show Banding
- In the Header options, change the background color to white to hide the column names
- Resize your columns:
- The team image column can be as narrow as possible
- Resize the GF/G column to fit the panel, unfortunately there’s no way to expand to the size of the tile yet.
- Title
- Note that when duplicating, the new columns you pull in will need to be sorted, filtered, and formatted, but you can copy the rest of the formatting from the original by duplicating.
Dataset
Tables and Datasets > Workspaces > Workout Wednesday > 2024W31 – Can you set Image Links? > NHL 2023-2024 Regular Season > Team
Share
After you finish your workout, share on LinkedIn, Sigma’s Community page, (or Twitter) using the hashtags #WOW2024 and #SigmaComputing, and tag Ashley Bennett, Eric Heidbreder, Katrina Menne, and Michal Shaffer!
Create an interactive, sharable version of your solution here.
Also, make sure to fill out the Submission Tracker so that we can count you as a participant this week to track our participation throughout the year.
Solution
Coming Soon!
