Introduction
Have I expressed my deep appreciation for Input Tables? With Snowflake or Databricks, we can write back to the database, which allows for some great methods of simplifying getting user-maintained information into a database.
Even though I am a big fan of input tables, it’s still risky to allow users to edit a database table directly. If that table is used in production, and someone deletes a row or changes a column name, we have issues on our hands.
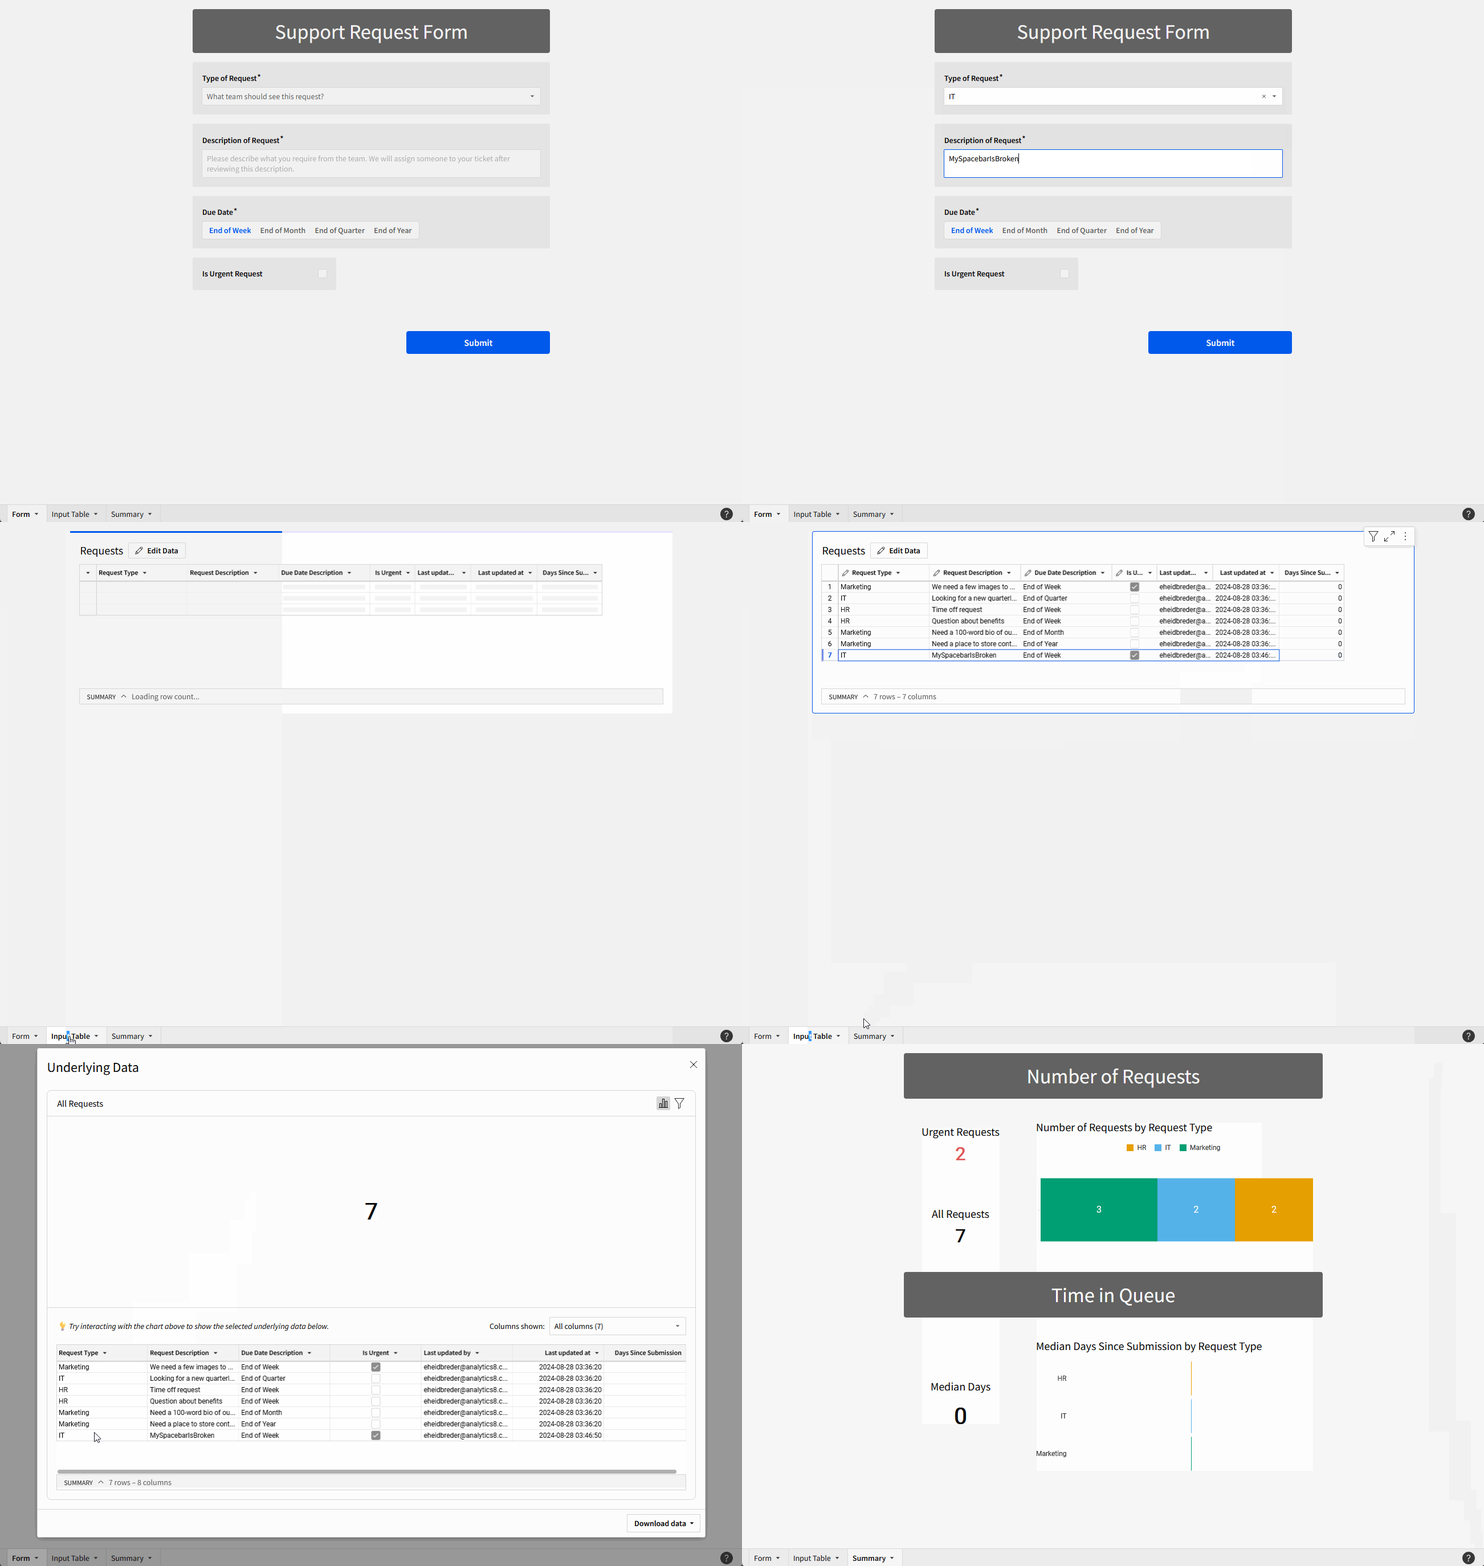
I’m excited to have gotten to host this week, because the functionality to Input Rows using actions was released just last week! So join us on this bleeding edge Workout Wednesday, where we’ll show you how to create forms, which can help separate the ‘Input’ part of input tables and give you more control over how users interact with tables that are writing back to your database.
[Note: This feature is in beta and is subject to change, so if you notice any new functionality that you’d like to see, head to this Sigma Community Page article to leave some thoughts!
Need access to Sigma?
Note: You will only have view access to WOW Workbooks, Folders, and Workspaces, not edit access. Please create your WOW Workbooks under “My Documents.” We suggest creating a folder to organize all your workbooks.
Requirements
- Set up your Form
- Add a list control for ‘Type of Request’
- Values
- Marketing
- IT
- HR
- Do not allow multiple selections
- Do now show null option
- Control ID = Type-of-request
- Required = Yes
- Formatting
- Show Background
- Change background color to light grey
- Set placeholder as ‘What team should see this request?’
- Values
- Add a text are control for ‘Description of Request’
- Required = Yes
- Control ID = Description-of-request
- Formatting
- Copy from the first
- Placeholder is ‘Please describe what you require from the team. We will assign someone to your ticket after reviewing this description.’
- Add a segment control for ‘Due Date’
- Values
- End of Week
- End of Month
- End of Quarter
- End of Year
- Required = Yes
- Control ID = Due-date
- Values
- Add a checkbox control for ‘Is Urgent Request’
- Required = No
- Control ID = Is-urgent-request
- Add a button, label it ‘Submit’
- Update formatting as desired
- Add a list control for ‘Type of Request’
- Set up your input table
- Create a new input table called ‘Support Requests’
- Use the Sigma Sample Database
- Add Text columns
- Request Type
- Request Description
- Due Date
- Add a Checkbox column
- Is Urgent
- Add system columns
- Last updated by
- Last updated at (if you’re okay with users seeing each others’ emails)
- Add a calculation for ‘Days Since Submission’
- DateDiff(“day”, [Last updated at], Now())
- IMPORTANT: Set the ‘Data entry permission’ on the input table to ‘Published Version’, or you’ll only be able to add rows in edit mode.
- Create a new input table called ‘Support Requests’
- Set up an Action to Insert a Row when you click the button
- Click the ‘Submit’ button to highlight it
- Select the ‘Actions’ button on the left toolbar
- Click the plus sign next to ‘On click’
- Action = Insert Row
- Into = Support Requests
- Update all of the values so they connect to the appropriate control
- Note that ‘Is Urgent’ must be a checkbox field, or the checkbox control will show as ‘invalid’
- Add some values to the controls and hit ‘Submit’ to see if that record shows up in your input table!
- Create some summaries to track progress
- KPI showing the number of requests
- Center aligned layout
- KPI showing the number of urgent requests
- Highlight this in red if the request is > 0
- Horizontal Bar Chart that shows the number of rows by Request Type
- Hide all gridlines, show labels
- Get just the row count by clicking the + sign next to ‘X-Axis’ and selecting ‘Row Count’
- Drag ‘Request Type’ on top of the ‘Color’ tab
- KPI showing Median of Days Since Submission
- Bar Chart showing Median Days Since Submission by Request Type
- Remove everything except the Y Axis labels, and Data Labels
- Duplicate the Request Type column to be able to add it to the ‘Color’ tab. We want consistent colors for Marketing, IT, and HR through this whole summary.
- Note that if we do this, we can remove the legend from the second visualization
- Add text boxes for ‘Number of Requests’ and ‘Time in Queue’ to organize the workbook into sections
- Arrange tiles as desired
- KPI showing the number of requests
- Future steps
- Add a method to check off the requests when they are responded to into the Input table, filter the input table to ‘Is Responded To’ = False
Dataset
None! Using an input table created in the steps.
Share
After you finish your workout, share on LinkedIn, Sigma’s Community page, (or Twitter) using the hashtags #WOW2024 and #SigmaComputing, and tag Ashley Bennett, Eric Heidbreder, Katrina Menne, and Michal Shaffer!
Create an interactive, sharable version of your solution here.
Also, make sure to fill out the Submission Tracker so that we can count you as a participant this week to track our participation throughout the year.
Solution
Coming Soon!
