Introduction
Need access to Sigma?
Note: You will only have view access to WOW Workbooks, Folders, and Workspaces, not edit access. Please create your WOW Workbooks under “My Documents.” We suggest creating a folder to organize all your workbooks.
Requirements
- Add your source data to a ‘Source’ tab
- Sigma Sample Database > RETAIL > PLUGS_ELECTRONICS > PLUGS_ELECTRONICS_HANDS_ON_LAB_DATA
- Group the data by ‘Date’ and the ‘Profit’ Metric
- You can hide or delete the rest of the fields
- Create two new tabs
- Hidden Controls
- Right click this tab and hide it
- Visualization
- Hidden Controls
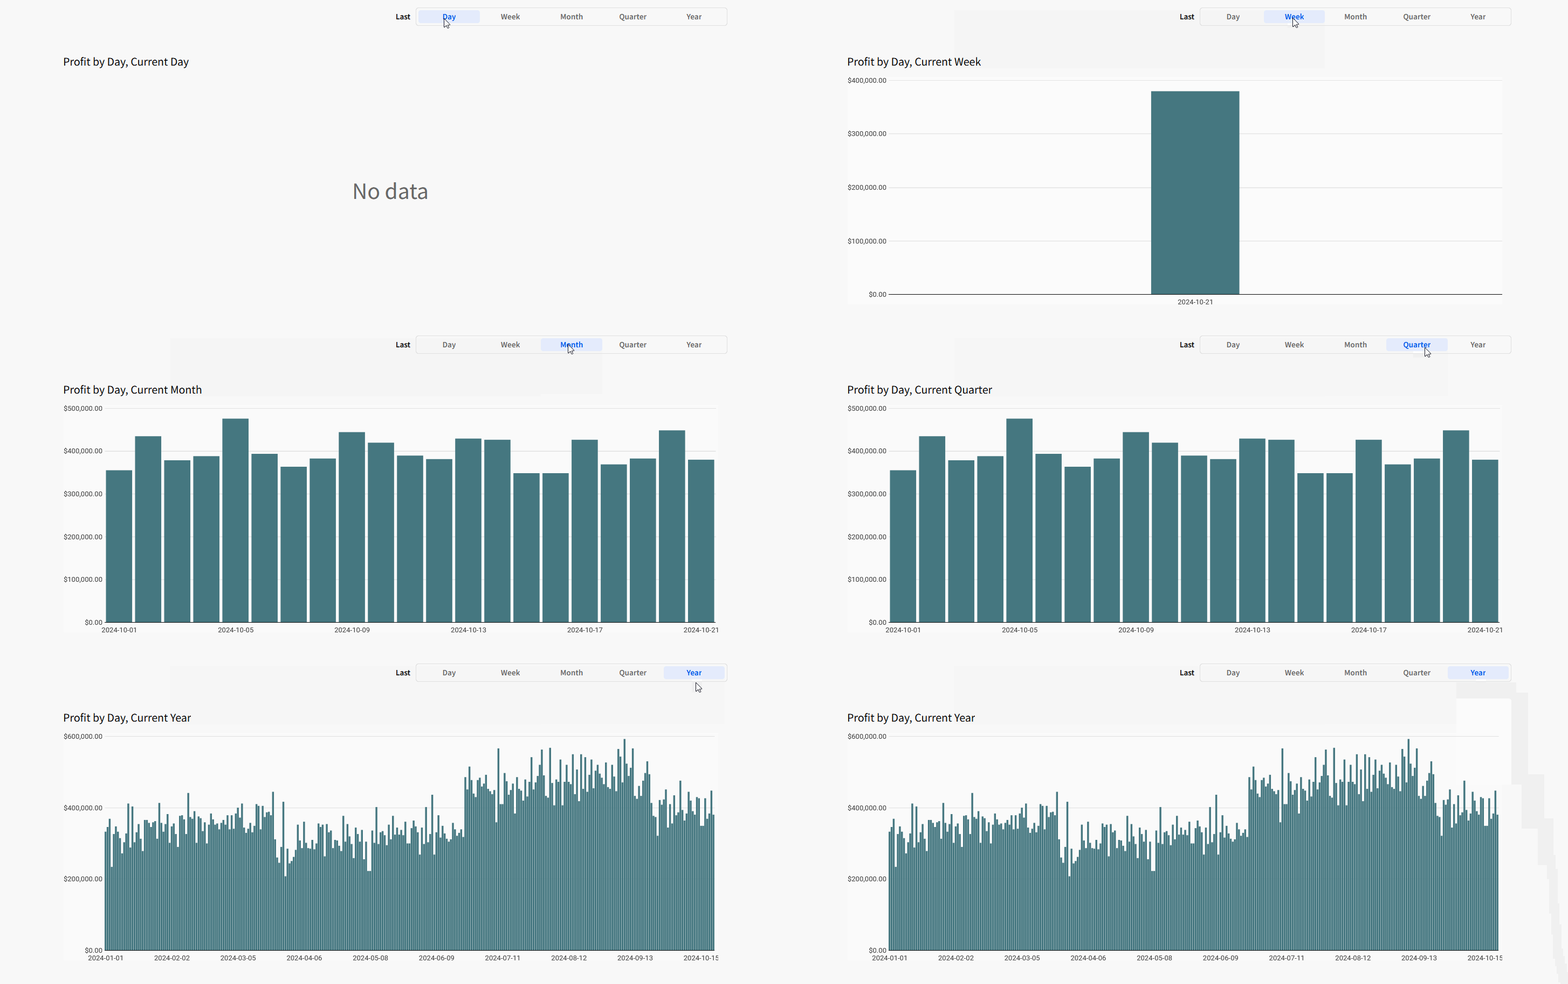
- Create your visualization
- Make a bar chart with the table element we created in the first step as the source
- Move the ‘Date’ to the X-axis
- Move ‘Profit’ to the Y-axis
- Create two controls
- Date
- Should be a standard date control that targets the visualization
- Move this control to the ‘Hidden Controls’ tab
- Last
- Should be a Segmented control with the following segments
- Day
- Week
- Month
- Quarter
- Year
- Set the control ID to ‘Date-Action-Trigger’
- Note there is no target for this control
- Should be a Segmented control with the following segments
- Date
- Add your actions to the Date-Action-Trigger control
- Add 5 actions as follows
- Condition = Control value is equal to Day
- Action = Set Control Value
- Update Control = Day of Date
- Set Value as = Static Values > Last 1 Days (include today)
- Repeat for all the other date ranges
- Add 5 actions as follows
- Update your action and watch the bar chart update with the selected date range
- Format your visualization
- Update the X-Axis
- Scale Type = Time
- Color the visualization By Scale
- Field = Profit
- Color = One of the diverging options
- Customize domain
- Minimum Value = -0.1
- Middle Value = 0
- Maximum Value = 0.1
- Customize domain
- Update the X-Axis
Dataset
Connections > Sigma Sample Database > RETAIL > PLUGS_ELECTRONICS > PLUGS_ELECTRONICS_HANDS_ON_LAB_DATA
Share
After you finish your workout, share on LinkedIn, Sigma’s Community page, (or Twitter) using the hashtags #WOW2024 and #SigmaComputing, and tag Ashley Bennett, Eric Heidbreder, Katrina Menne, and Michal Shaffer!
Create an interactive, sharable version of your solution here.
Also, make sure to fill out the Submission Tracker so that we can count you as a participant this week to track our participation throughout the year.
Solution
Coming Soon!
