Introduction
I felt like I was seeing more news about food recalls lately, and I did the thing any good data-minded individual would do: pulled down data from the FDA to see if what I’m feeling is backed up by data.
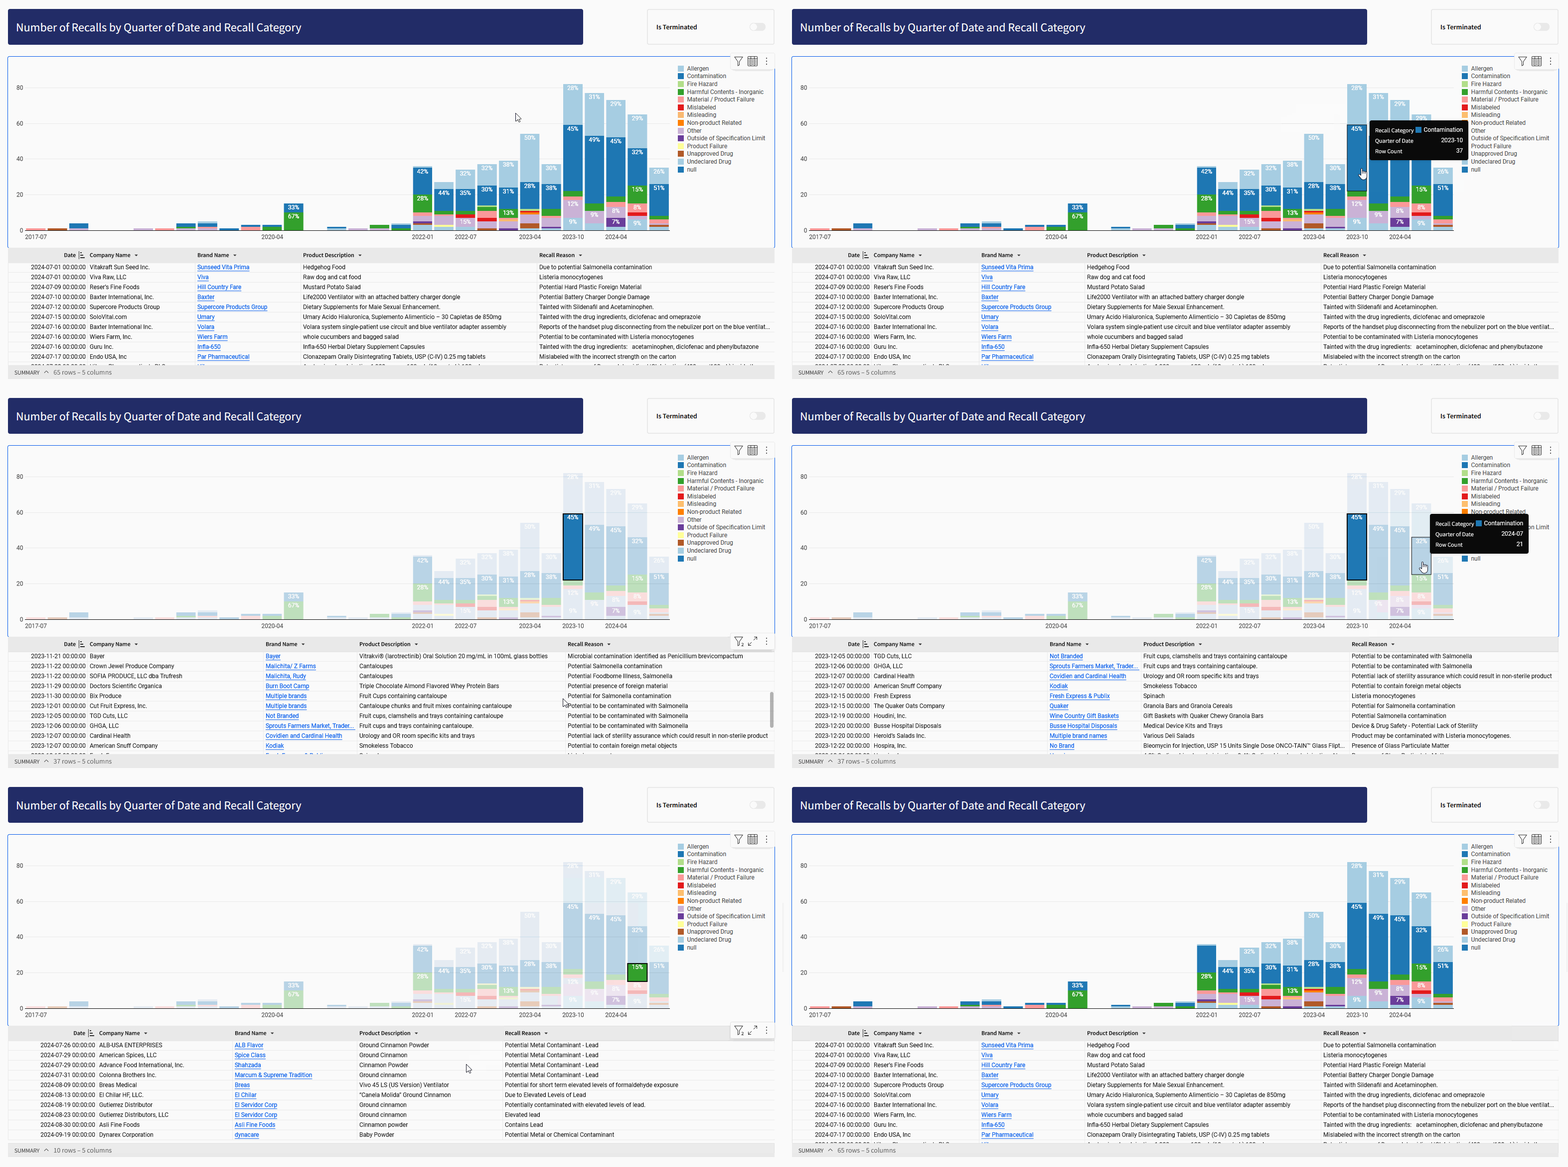
When I pulled the data down from, I realized there was still a lot of work to be done, as the recall reasons seem to be free-text inputs. Nevertheless, with the help of GitHub Copilot, I made a first pass at categorizing the recalls into more general categories for analysis and created an interactive visual.
What we have here is a relatively simple visual that I always come back to, giving users a snappy, interactive feel without having to run new queries. I hope you’ll add this to your toolbox!
Need access to Sigma?
Note: You will only have view access to WOW Workbooks, Folders, and Workspaces, not edit access. Please create your WOW Workbooks under “My Documents.” We suggest creating a folder to organize all your workbooks.
Requirements
- Add your source data to a ‘Sources’ tab
- Create a new table element, get your data from Tables and Datasets > Workspaces > Workout Wednesday > 2024W47 Can you check for recalls? > FDA Recalls
- Create your bar chart visualization
- Create a new bar chart visualization where the source is the FDA Recalls table in your Source tab (not the original data model)
- Set the X-axis to date, and truncate the date to Quarter
- Add a Row Count to the Y-axis (click the + sign)
- Drag ‘Recall Category’ to the ‘Color’ section to color by the category
- Format the bar chart
- Hide the title
- X – Axis
- Scale = Time
- Data Labels
- Enable Data Labels
- Position = End
- Display Value as a Percent and remove the decimal places
- Create your detail table element (FDA Recalls – Detail)
- Create a new table element where the source is the FDA Recalls table in your Source tab (not the original data model)
- Order the columns as: Date, Company Name, Brand Name, Product Description, Recall Reason
- Right click on ‘Brand Name’ and go to Transform > Set Link to set the link as the [link] column
- Format the table
- Hide the title
- Create three controls
- Recall Category (List)
- Is Terminated (Segmented Control with an option to clear)
- Date (Date)
- All the controls should target the Visualization > FDA Recalls – Detail table
- Create an action to update the detail table when a user selects a segment in the bar chart:
- Set Recall Category
- Set Date
- Arrange the charts, I like to store them all in a container and remove element gaps for a more compact feel
Dataset
Tables and Datasets > Workspaces > Workout Wednesday > 2024W47 – Can you check for recalls? > FDA Recalls
Share
After you finish your workout, share on LinkedIn, Sigma’s Community page, (or Twitter) using the hashtags #WOW2024 and #SigmaComputing, and tag Ashley Bennett, Eric Heidbreder, Katrina Menne, and Michal Shaffer!
Create an interactive, sharable version of your solution here.
Also, make sure to fill out the Submission Tracker so that we can count you as a participant this week to track our participation throughout the year.
Solution
Coming Soon!
