Introduction
I am honored to join as a new contributor starting from 2024. I have gained immense skills and motivation from the Tableau community, including Workout Wednesday.As a way to give back to the community, I am committed to providing valuable and enjoyable challenges!
Now, let me introduce a challenge about donut charts that I encountered in my professional work. While there are various opinions about pie charts, I still believe they have value in certain situations, such as:
- Comparing the proportions of two elements.
- Representing the degree of achievement of KPIs.
In business, KPIs like sales targets often end up exceeding 100%. This technique was developed in response to requests to represent the extra effort beyond 100% in donut charts. Ideally, other chart types should be chosen for KPIs that can exceed 100%, but it’s common to be in situations like mid-fiscal year where changing the chart type isn’t feasible.
I encourage you to take on this challenge!
Requirements
- Dashboard Size: 1366*768
- Number of Sheets: 2
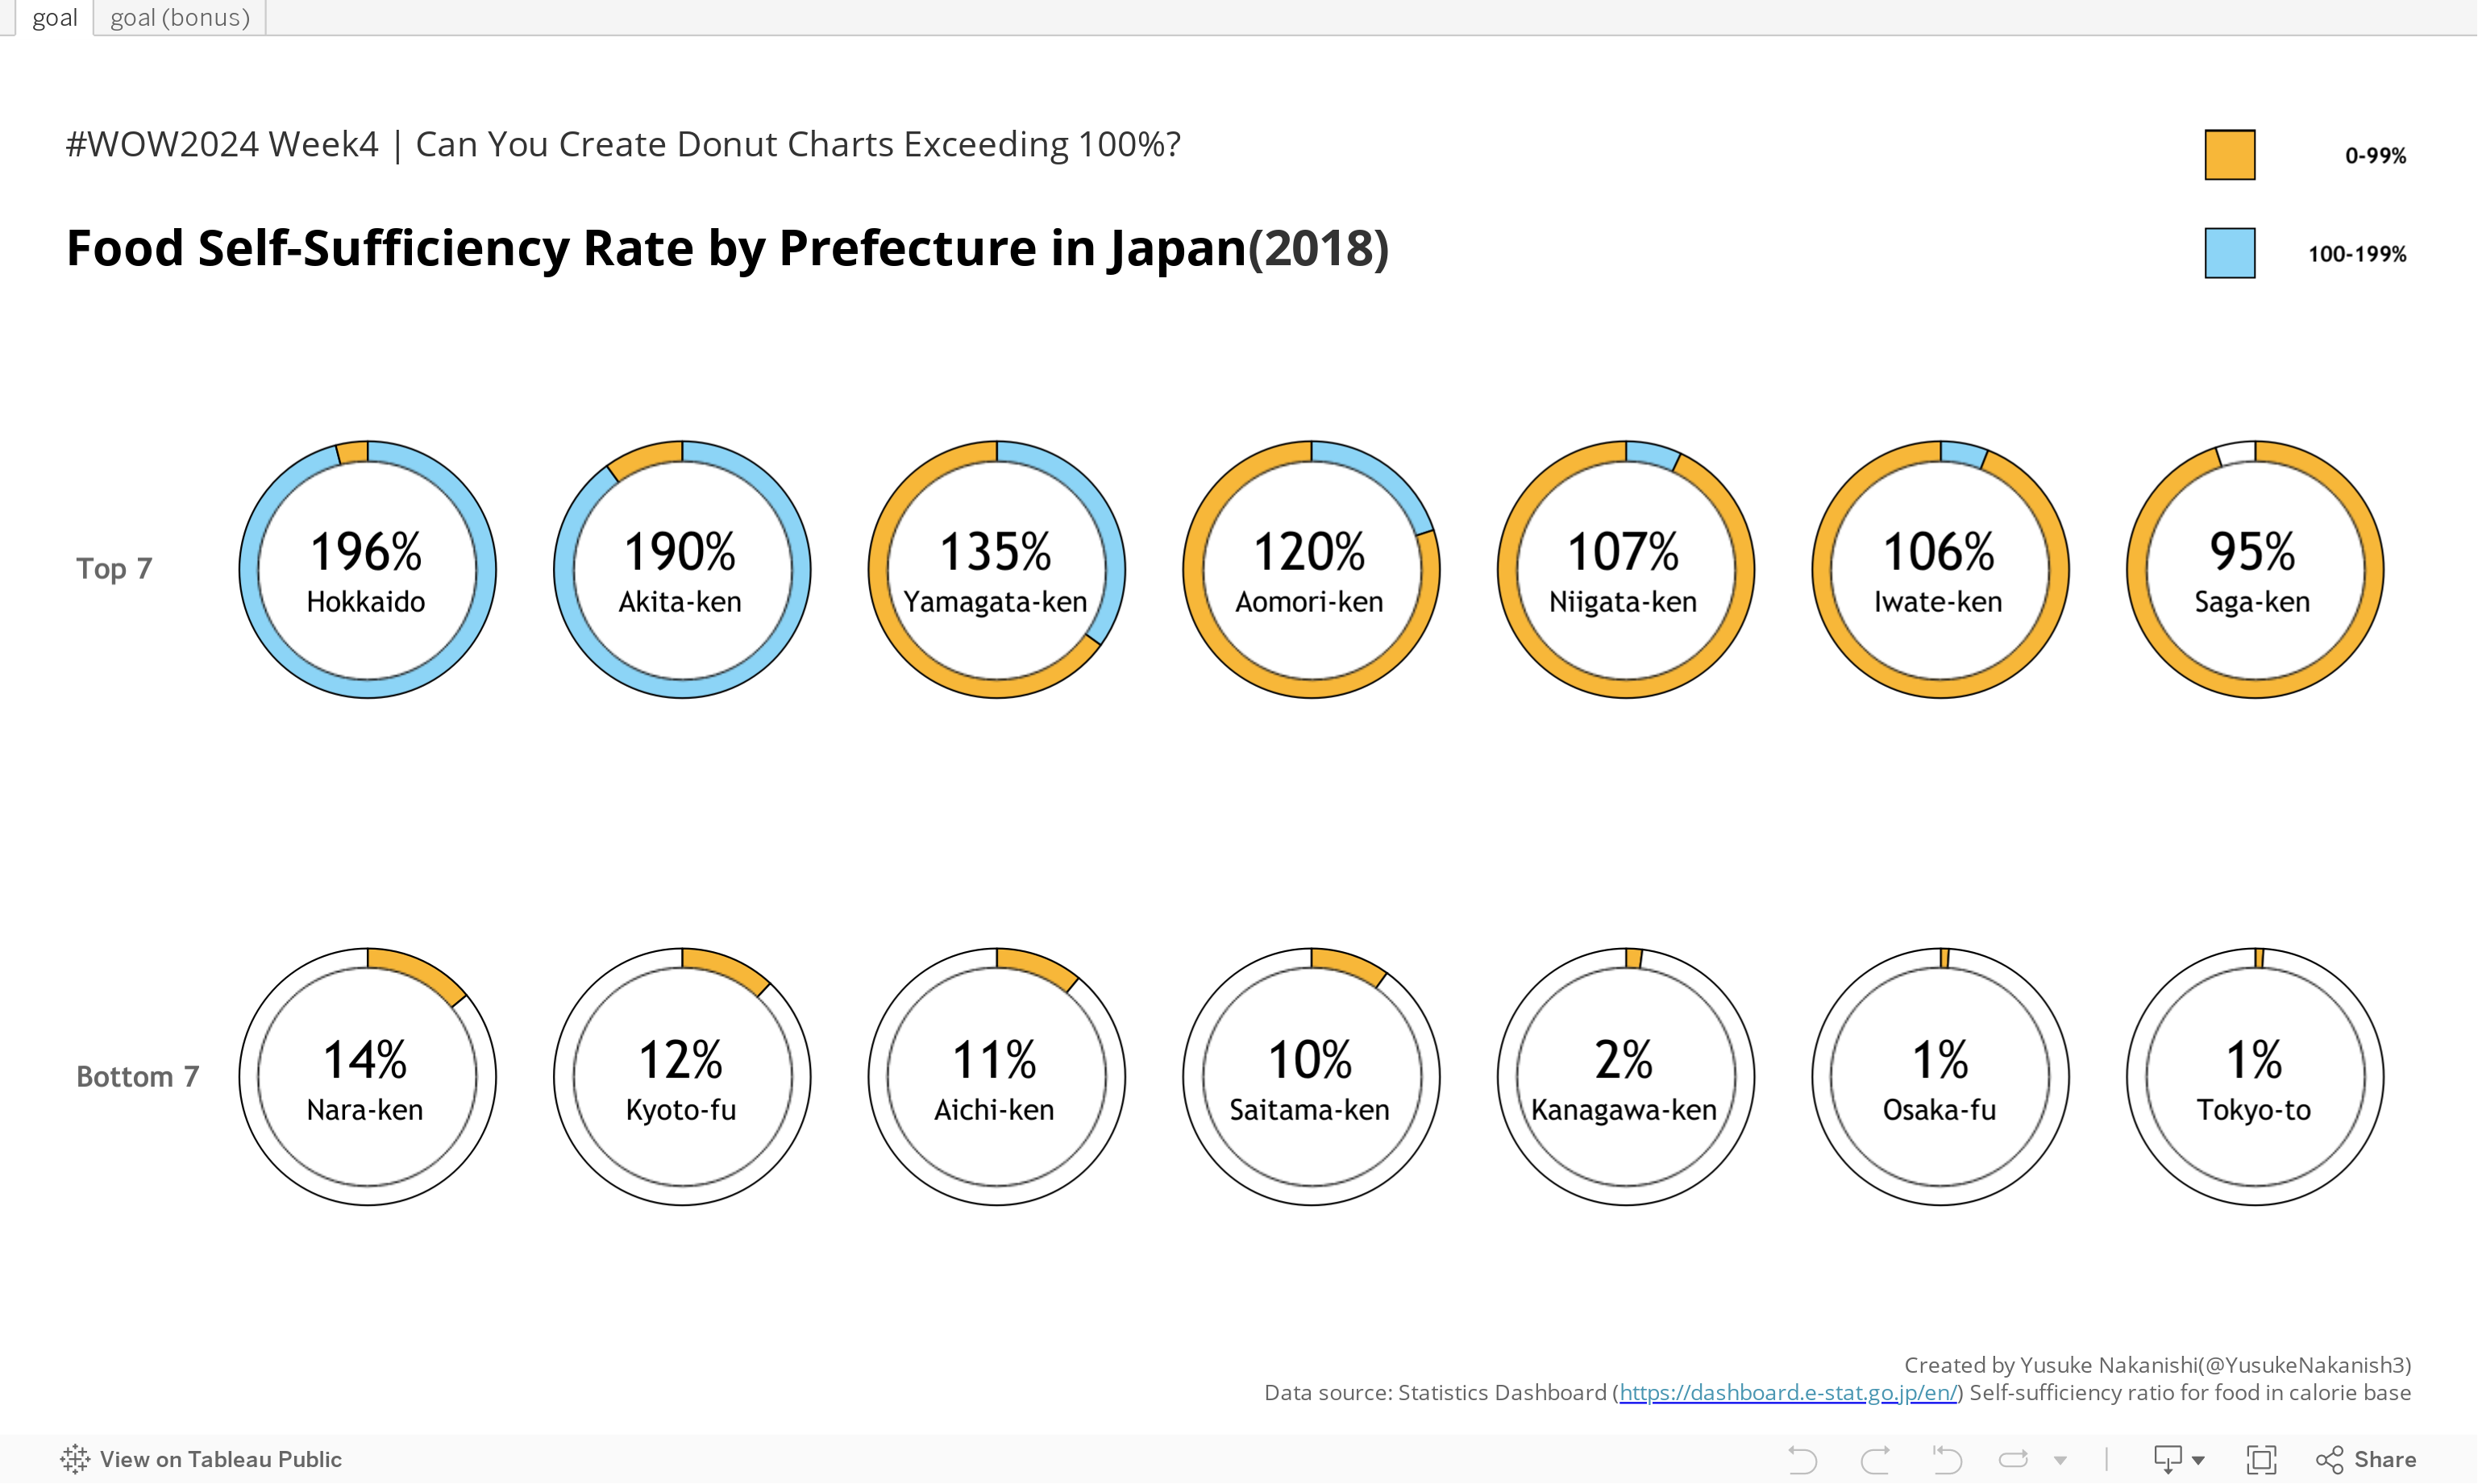
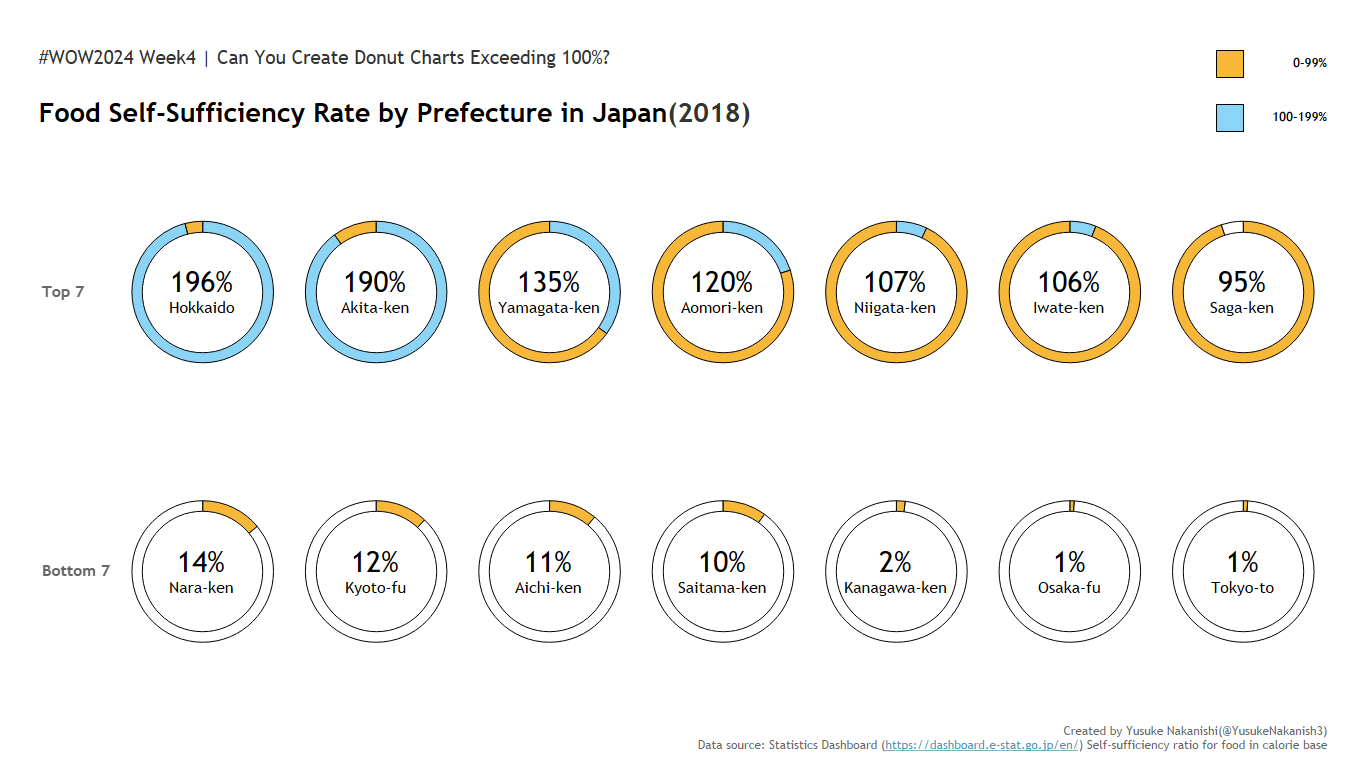
- Represent the top 7 and bottom 7 prefectures in Japan in terms of food self-sufficiency ratio using donut charts.
- Display labels with food self-sufficiency ratio and prefecture names.
- Set the display target year (Fiscal Year) to “FY2018” only.
- Feel free to use any colors.
- No tooltips.
Bonus Challenge
- In FY2019, there are prefectures where the value exceeded 200%. Change the display target year to “FY2019”, and try to color code the prefectures exceeding 200% in the same way as when at 100%.*
- Display all 47 prefectures in a layout of 10 columns by 5 rows.
*Note:As mentioned in the introduction, donut charts should ideally not be used in cases where values exceed 200%.
Dataset
This challenge uses a data set from (Statistics Dashboard / https://dashboard.e-stat.go.jp/en/ Self-sufficiency ratio for food in calorie base), but some column names are changed to make it comprehensive, and is available from here.
Attribute
When you publish your solution on Tableau Public make sure to take the time and include a link to the original inspiration. Also include the hashtag #WOW2024 in your description to make it searchable!

Share
After you finish your workout, share on Twitter and/or LinkedIn using the hashtag #WOW2024 #Tableau and tag @WorkoutWednsday
Solution
Interactive