Introduction
I may have gotten a little overexcited with this challenge by combining TWO problems that some of my colleagues came up against recently when trying to solve problems for their clients. That being said, this week’s challenge should be a good workout.
Since the challenge applies some more advanced calculations, I have broken down the requirements into different levels. I’m hoping this helps everyone find a way to enjoy it and learn something new!
Requirements
- Dashboard Size: 1000 x 1000px
- 1 sheet
- This challenges uses the SALES (Modified) field in order to get more interesting lines to work with. This field is included in the data set that is linked below. Alternatively, use the following calculation for SALES (Modified):
-
-
- IFSUM([Sales])<5000 THEN SUM([Sales])*10 ELSE SUM([Sales]) END
-
-
- Create a line chart for each State that displays SALES (Modified) by Quarter
- Use a Small Multiples chart to display these lines in a grid with 3 columns.
Intermediate:
All Beginner Level Requirements, plus:
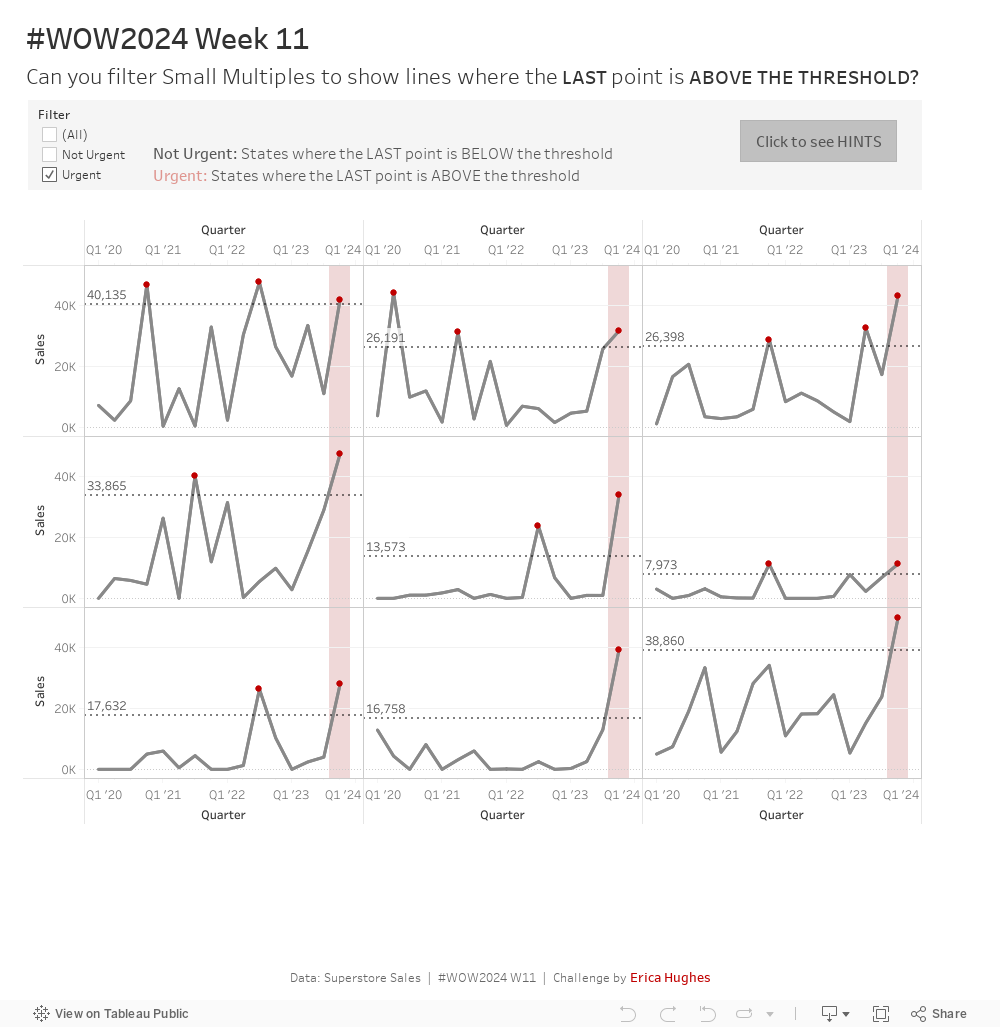
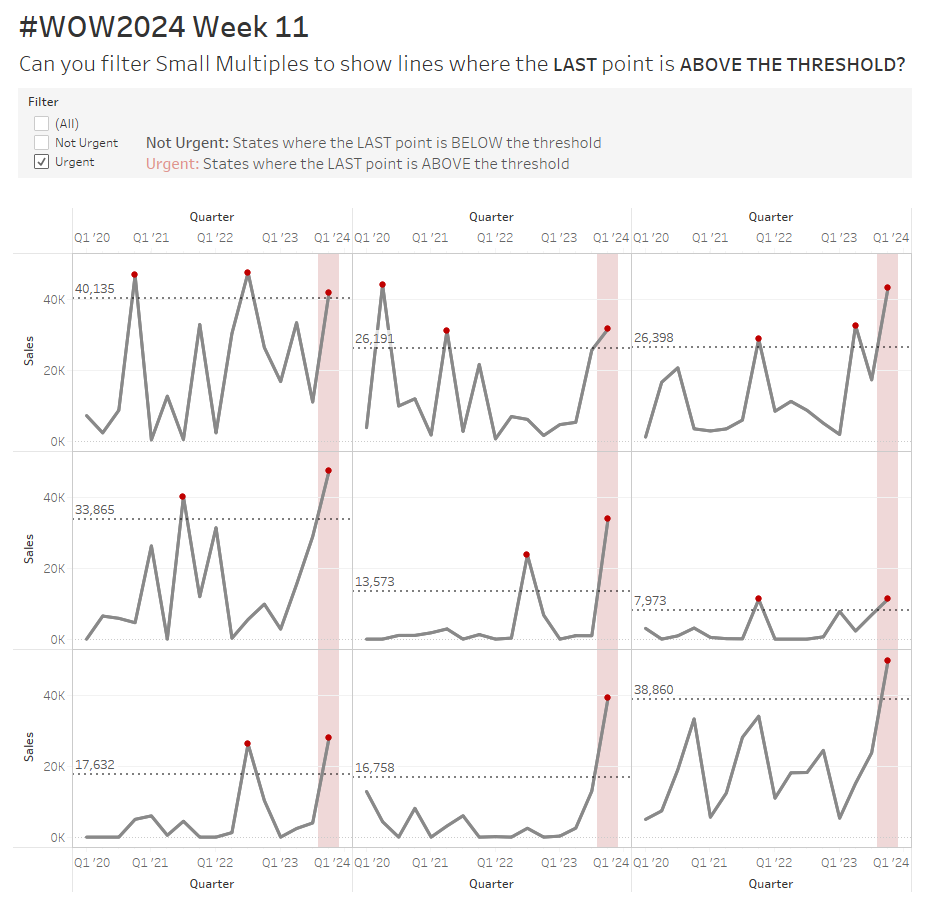
- Add a reference line for each State. The line represents a ‘Threshold’ value, defined as the AVERAGE Sales (Modified) value for each State, multiplied by 2.
- Use a red circle to highlight all the points where the Sales (Modified) goes ABOVE the Threshold.
- Add a pale red Reference Band around the final point IF this point is above the Threshold.
A State is classified as ‘Urgent’ if the LAST point in the line is above the threshold.
- Fill in missing values with a ZERO, such that every State has a continuous, unbroken line (this is most obvious in the ‘Not Urgent’ States)
- Sort the States based on whether they are ‘Urgent’ AND how many points they have above the Threshold in total across all time.
- Allow users to filter only to the ‘Urgent’ States. By default, the dashboard should only show ‘Urgent states’, with the ability to later see all the states if desired.
- Match tooltips and formatting (Colours: grey – #898989 , red – #c00000 )
Dataset
This week uses 2023 Superstore Data. If you download the hyper file from Data.World you will have access to the Modified Sales calculation that I used in my dashboard.
You can find it here
Attribute
When you publish your solution on Tableau Public make sure to take the time and include a link to the original inspiration. Also include the hashtag #WOW2024 in your description to make it searchable!

Share
After you finish your workout, share on Twitter and/or LinkedIn using the hashtag #WOW2024 #Tableau and tag @WorkoutWednsday and @_hughej
Solution
Interactive