Introduction
For the final week of Community Month, it is my pleasure to introduce you to a new Guest Coach on the Workout Wednesday team, Deborah Simmonds. For a number of years, Deb has been one of the most dedicated #WOW participants, so I was delighted to invite her to create her own challenge for you. It’s safe to say that she has delivered! Best of all, it uses a fun data set (no Superstore this week)
From Deb:
“I look forward to the WOW challenges each week and have learned that even the hardest ones can be achieved with the encouragement and content of the incredibly supportive community. My favourite part is seeing all the different techniques and solutions, so I am delighted to have the opportunity to set my own challenge and I can’t wait to see and learn from your approaches!
With Tableau Conference 2024 just around the corner, what better time to have another look at Brittany Rosenau’s TC23 Step Counts data? Which hotel accrued the most steps, and who walked further than average?
I found this to be a tricky task, so have thrown all sorts of calculations into the mix to make it work”
Requirements
- Dashboard size: 1000 x 800px
- As many sheets as you like
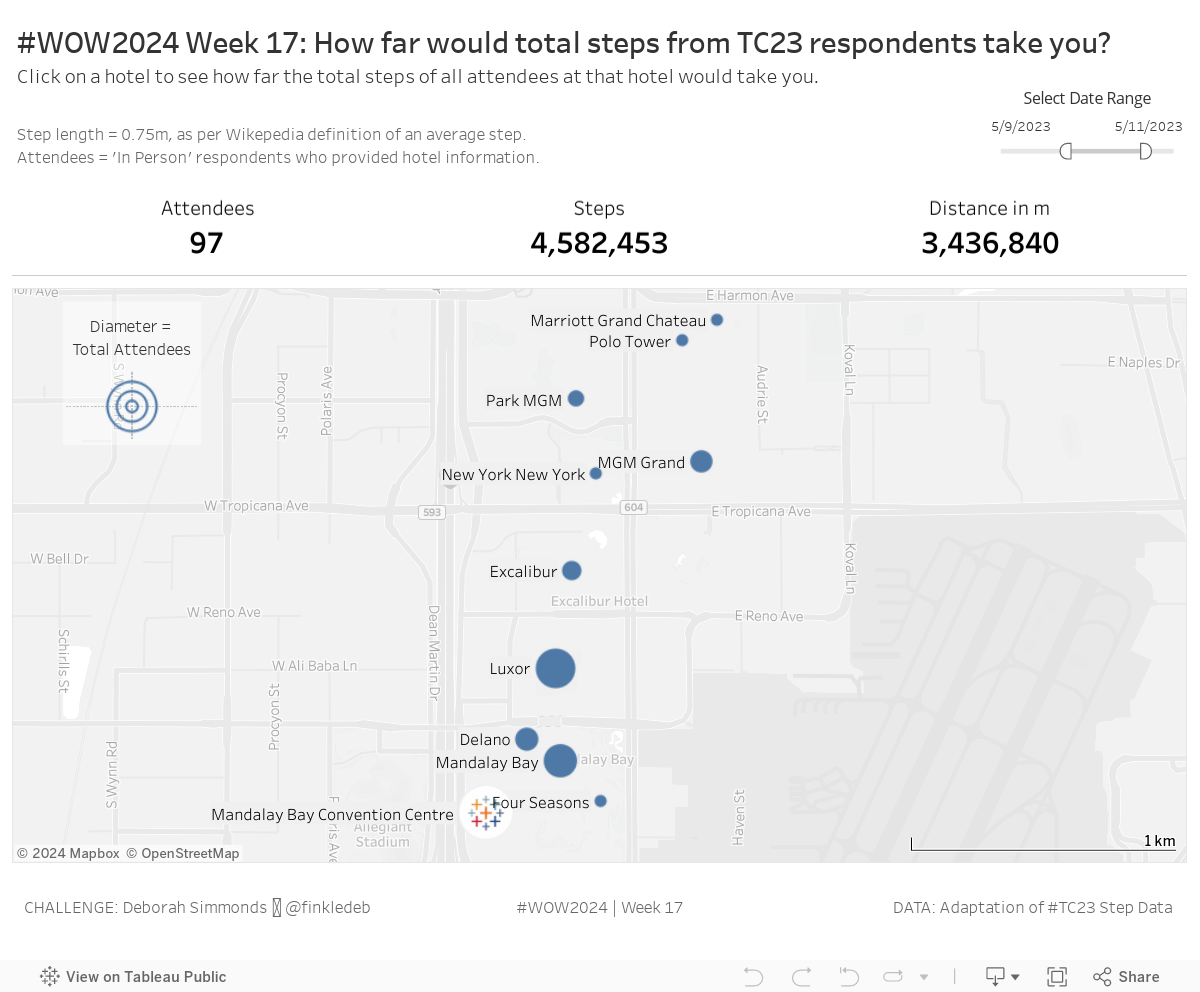
- Show hotels and Convention Centre on the map.
- When selected these should zoom to that location at the centre and show a buffer using the total distance of the attendees’ steps as the diameter.
- BANs of Attendees, Steps and Distance in m should reflect the selected location and show all for both the Convention Centre and no selection.
- Create a calculated field to fill in any missing names with “User ID:” plus the user ID
- Include a selectable date range.
- Use a different icon for the convention centre, I used the Tableau logo.
- Include a dynamic legend that changes when a location has been selected & zoomed in.
Viz in Tooltip
- Show the total steps per attendee for the selected period in descending order.
- Include a reference line that shows the average steps per attendee for the same period.
- Colour the bars of those attendees who’s step count was above average for the period
Logic
- Attendees = ‘In Person’ respondents who provided hotel information and had step data within the selected dates.
- Distance = 0.75m per step as per Wikipedia average step distance.
- Hotel size = total attendees who stayed at that hotel, Convention Centre size = all attendees.
Combine the original data with the ‘Locations’ csv file, containing coordinates and locations, without cleaning it first. The ‘Locations’ csv file can be found on Data.World
Occasionally this is a real-world ad-hoc requirement, but cleaning steps and preparation are always preferable.
Dataset
This challenge uses an adaptation of Brittany Rosenau’s step data from Tableau Conference 2023, that includes locations of each hotel and the Mandalay Bay Convention Center where the conference was held.
The data used in the solution workbook is available here
Named ‘How many steps did you take at Tableau Conference?’
Read Brittany’s blog post and access the original data here.
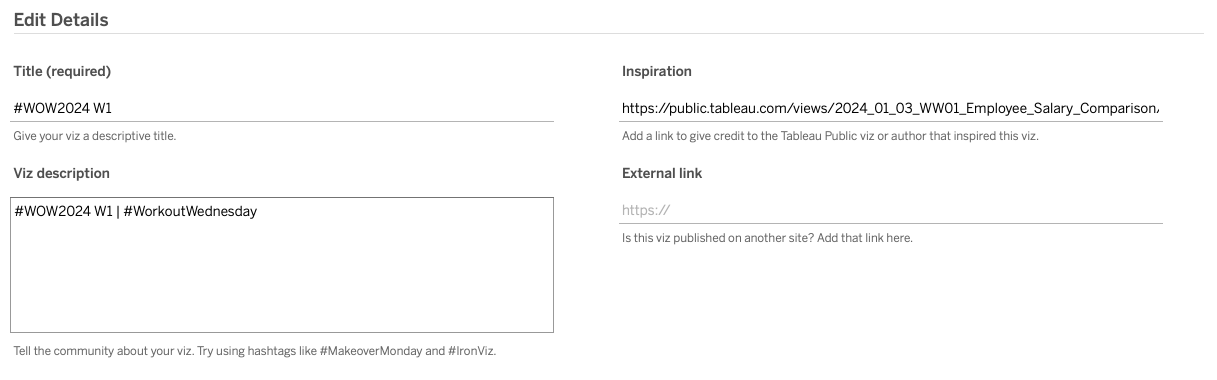
Attribute
When you publish your solution on Tableau Public make sure to take the time and include a link to the original inspiration. Also include the hashtag #WOW2024 in your description to make it searchable!
Share
After you finish your workout, share on Twitter and/or LinkedIn using the hashtag #WOW2024 #Tableau and tag @WorkoutWednsday, @finkledeb and @_hughej
Solution
Interactive