Introduction
The 33rd Summer Olympic Games started in Paris last week, so we have an Olympic themed challenge this week, and I hope this is a fun one.
When researching ideas, I saw this viz on my colleague, James Newton’s (Twitter|X / Linked In ), Tableau Public profile and thought it would be good fun to recreate. I managed to replicate and with James’ permission am now sharing as a challenge for you all.
It incorporates some features we don’t tend to use that often in WOW challenges or business dashboards, but are always worth knowing about – background images and animation via the pages shelf.
I’m conscious that this may be a bit tricky, so I’ll try to be a bit more expansive on the requirements, without giving you all the calculations, but see hints if you get really stuck, and of course you can always download my solution if you get really really stuck!
Requirements
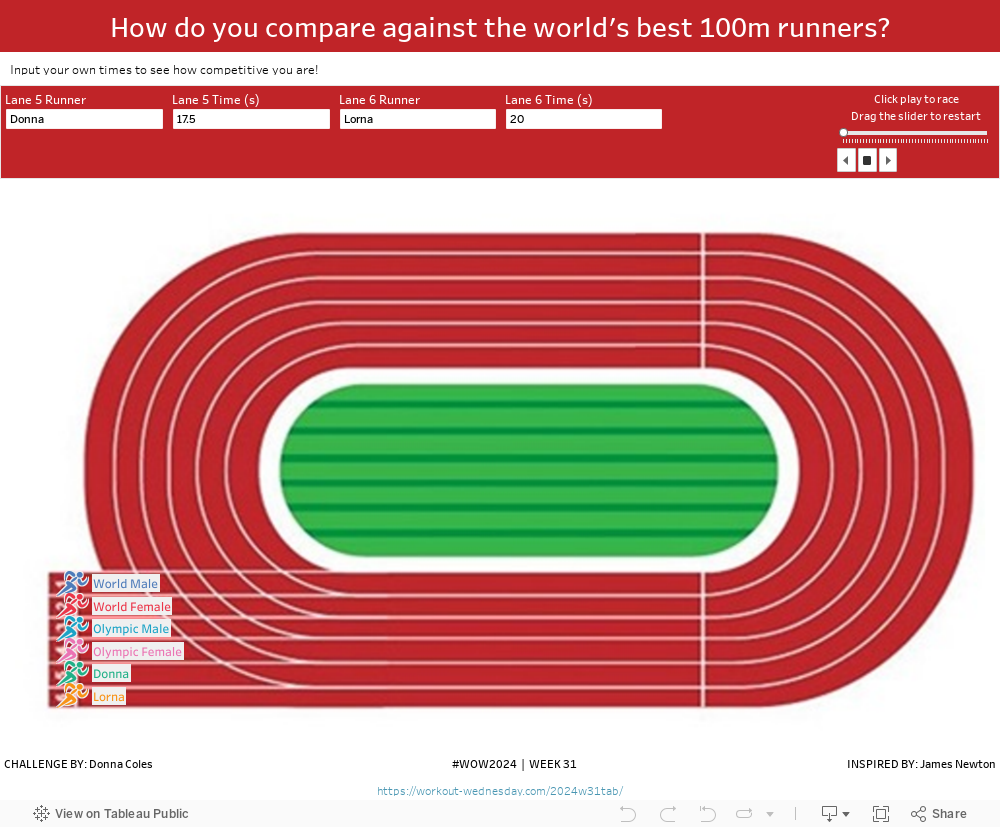
We will be plotting the position of each runner as they move along the running track.
The details related to the runners in lanes 1-4 are provided in a file. The details for lanes 5 & 6 are via user inputs, but these do not have to be provided.
- Dashboard 1000 x 800
- Model the data using the files provided
- Records.csv – contains details for the runners in lanes 1-4
- Points.csv – for each lane the race start & end X & Y co-ordinates are provided
- Scaffold.csv – provides a marker for each point we’re going to need to plot between the race start and end.
- I found I needed to use physical joins rather than relationships.
- The Records data should be left joined to the Points data via Lane and Event
- The Scaffold data should be left joined to the Points data via Event
- It is assumed that each runner ‘runs’ at a uniform rate – ie it takes the same ‘time’ to move between each marker (we won’t be dealing with any concept of acceleration or deceleration in this challenge 🙂 ). You will need to work out where to plot each runner in each lane for each marker (ie the x & y co-ordinate per marker). For this you will need to work out
- the total ‘distance’ covered by the race
- the ‘distance’ covered per marker
- the time of the slowest runner, which may be one of those provided or a value inputted by the user
- for each runner the % of their time compared to the slowest runner
- if the slowest runner moves between each marker at the ‘distance covered per marker’ above, then work out how far each runner moves per marker using the proportion calculated above (eg someone completing the race in half the time of the slowest runner, should move twice the distance for each marker).
- use this to determine the x co-ordinate per marker per runner. Note the runner should stop once they reach the finish line
- Add labels to display only at the start and the end – the end labels include the time
- Add a background image (the image size is 500 x 288)
- Animate the ‘running’ of the race using the page control filter (note when publishing to Tableau Public the speed controls aren’t available)
- Match tooltips
- Total distance is the difference between the start and end X co-ordinates
- Distance per marker is Total distance / number of markers
- Time of slowest runner – find the maximum time of the records provided and the parameter inputs – the MAX([field 1], [field 2]) function can help.
- % of time compared to slowest runner, is just a basic proportion- Time/Slowest Time
- Distance per marker per runner : Distance per marker / proportion
- X-coordinate: From the starting point add on the relevant number of “Distance per marker per runner” increments for the marker, but if this is greater than the end point, then plot at the end point instead.
- Adding background image: https://help.tableau.com/current/pro/desktop/en-us/bkimages.htm – the max and min values for the x-axis are based on the size of the image
Dataset
The datasets and images required for this challenge are all available from here.
Attribute
When you publish your solution on Tableau Public make sure to take the time and include a link to the original inspiration. Also include the hashtag #WOW2024 in your description to make it searchable!

Share
After you finish your workout, share on Twitter|X and/or LinkedIn using the hashtag #WOW2024 #Tableau and tag @WorkoutWednsday and be sure to give James some love too on Twitter|X and/or Linked In: -)
Solution
Interactive