Introduction
Have you ever received a request to make the data displayed on a dashboard different depending on who is viewing it? For example, let’s think about a scenario where the sales for each sub-category are displayed, but the sub-categories shown vary depending on the viewer. It’s straightforward if one sub-category is to be displayed for a single individual. However, there are natural cases where multiple people or teams manage the sub-category and need to see its data.
Several approaches are available to handle such scenarios, such as data preparation, the RLS or Data Policies feature, using multiple ISMEMBEROF() functions with IF statements, etc…, but we will explore a solution using a secondary data source in this challenge. This approach has the advantage of requiring no modifications or settings on the data.
This challenge doesn’t require a complicated calculation. I hope you like the idea. Enjoy!
Requirements
Common
- Dashboard Size: 1000 x 800 px
- Number of Sheets: 4.
- No Relationship/JOIN. No modifications to the Superstore data. Assume a situation where you can’t edit the data source published on Tableau Server/Cloud.
- In this challenge, you are Alice logging into Tableau Server/Cloud to view this dashboard. To create this situation, make the following calculated field “Viewer Name”:
- ‘Alice’ //USERNAME()
- Only show the sub-categories assigned to Alice.
- Visualize the yearly sales by sub-category. You can choose the colors as you like.
- Display the viewer name and greet.
- Match tooltips and formatting as much as possible.
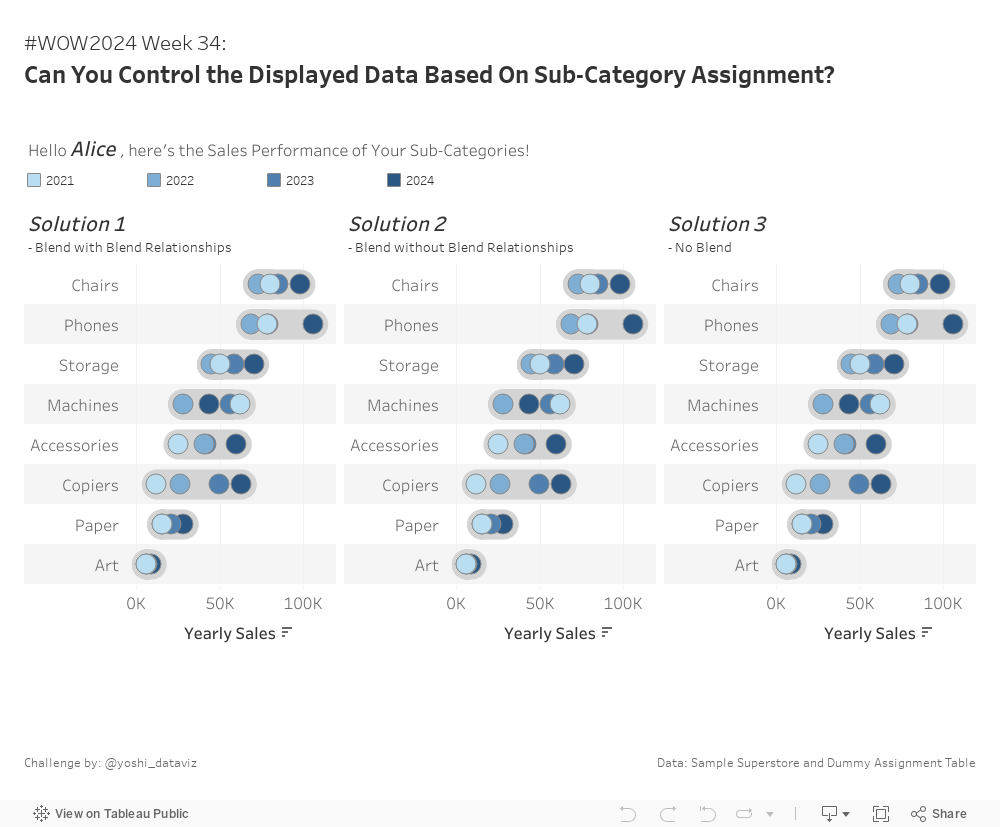
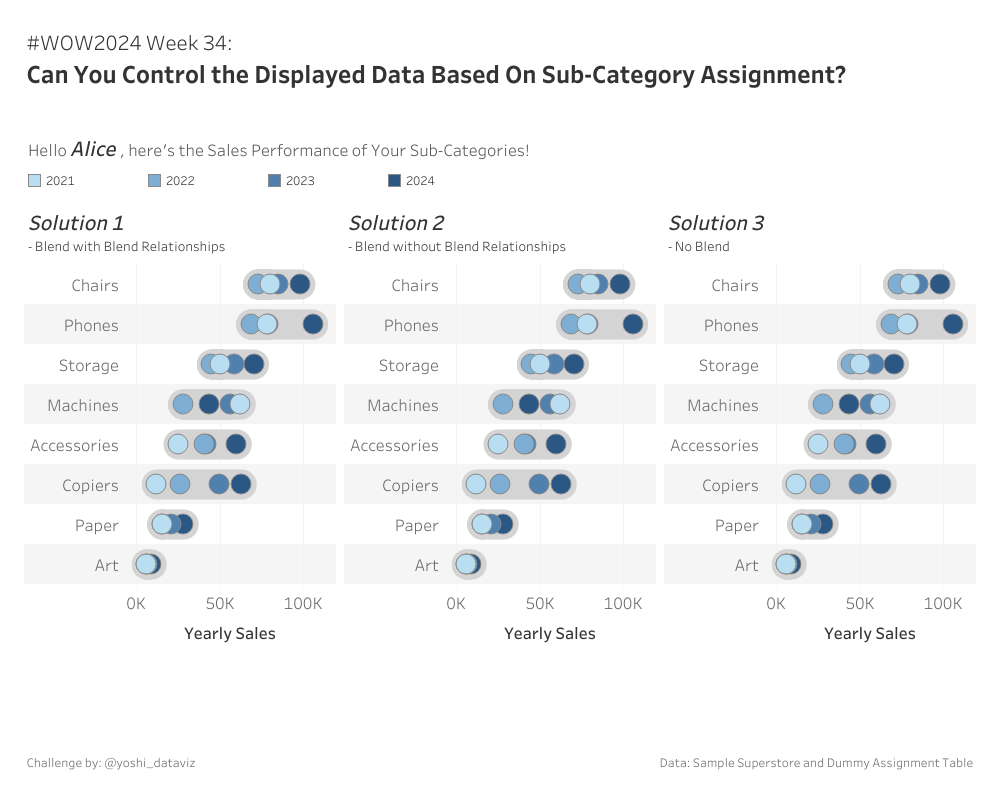
- Re-create the following three solutions.
Solution 1
- Use the “Solution 1” sheet from the “Assignees Table.xlsx” file.
- Set up the Blend Relationships appropriately.
- Use the “Solution 2 and 3” sheet.
- Don’t set any Blend Relationships.
- Blend can generally lead to performance degradation, especially when the Blend Relationships are complex. This approach assumes such a scenario and provides a workaround.
Solution 3
- Use the “Solution 2 and 3” sheet.
- No Blend: Ensure that the data source from the sheet and the Superstore data source are not used simultaneously in the view.
- This implementation allows you to use functions not supported with Blend, e.g., REGEXP functions (this challenge doesn’t necessarily require the functions. No worries!).
Parameter is your friend. Make sure its value “dynamically” differs depending on who opens the dashboard.
Dataset
Attribute
When you publish your solution on Tableau Public make sure to take the time and include a link to the original inspiration. Also include the hashtag #WOW2024 in your description to make it searchable!

Share
After you finish your workout, share on Twitter and/or LinkedIn using the hashtag #WOW2024 #Tableau and tag @WorkoutWednsday
Solution
Interactive