Introduction
Welcome to week 6! This week, we’re looking deeper into dynamic switching. I’ve liked creating elements that dynamically change the metric or the dimension, but I ran into an issue when I also needed to have a custom sort order for one of the dynamic dimensions.
I hope this helps you solve some edge case issues that come up with dynamically switching visualizations.
Need access to Sigma?
Note: You will only have view access to WOW Workbooks, Folders, and Workspaces, not edit access. Please create your WOW Workbooks under “My Documents.” We suggest creating a folder to organize all your workbooks.
Requirements
- Get your source data
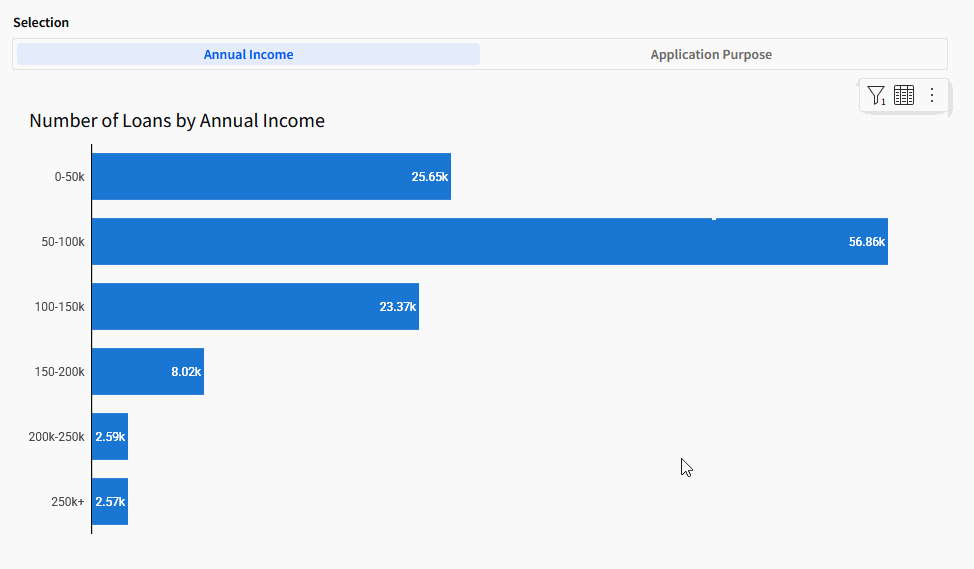
- Tables and Datasets > Connections > Sigma Sample Database > FINANCE > LENDING_CLUB > LOANS
- Create bins for Annual Income Total
- Choose(BinRange([Annual Income Total], 50000, 100000, 150000, 200000, 250000, 10000000), “0-50k”, “50-100k”, “100-150k”, “150-200k”, “200k-250k”, “250k+”)
- Create two ‘Sort’ input tables
- Annual Income Sort
- Order the buckets logically from lowest to highest
- Add a new calculated column called Annual Income Sort to get the ‘RowNumber()’
- Application Purpose Sort
- Order the Unique Application Purposes so that ‘Other’ is last
- Add a new calculated column called Application Purpose Sort to get the ‘RowNumber()’
- Annual Income Sort
- In the Source data table, add Lookups to both Input tables, you only need to pull in the ‘Sort’ columns
- Create a Control and a Bar Chart to handle dynamic switching
- Control
- Name it ‘Selection’, and set the Control ID to ‘Selection’
- Create a bar chart with the source as the LOANS table from earlier
- On the bar chart, create a Dynamic Selection and Dynamic Sort calculated field
- Dynamic Selection:
- Switch([Selection], “Annual Income”, [Annual Income Bucket], “Application Purpose”, [Application Purpose])
- Dynamic Sort:
- Switch([Selection], “Annual Income”, [Annual Income Sort (Annual Income Sort)], “Application Purpose”, [Application Purpose Sort (Application Purpose Sort)])
- Add a Row Count to the bar chart columns
- Control
- Set up your bar chart
- Horizontal
- Y-Axis = Dynamic Selection
- X-Axis
- Sum of Row Count
- HIDDEN – Dynamic Sort
- Also right click, go to ‘Set Aggregate’ and remove the aggregation from the Dynamic Sort field ONLY
Dataset
Tables and Datasets > Connections > Sigma Sample Database > FINANCE > LENDING_CLUB > LOANS
Share
After you finish your workout, share on LinkedIn, Sigma’s Community page, (or Twitter) using the hashtags #WOW2024 and #SigmaComputing, and tag Ashley Bennett, Eric Heidbreder, Katrina Menne, and Michal Shaffer!
Create an interactive, sharable version of your solution here.
Also, make sure to fill out the Submission Tracker so that we can count you as a participant this week to track our participation throughout the year.
Solution
Coming Soon!