Introduction
Aside from Battlebots Championships, NHL Stanley Cup Playoffs are my favorite sporting event of the year. And I think the logos are all so beautiful that they should be front and center when building out interactive data applications in Sigma.
I always take opportunities like this to show off the ability of Sigma to incorporate images into your data. Hope you’ll get some ideas out of this quick build based on data from espn.com!
Need access to Sigma?
Note: You will only have view access to WOW Workbooks, Folders, and Workspaces, not edit access. Please create your WOW Workbooks under “My Documents.” We suggest creating a folder to organize all your workbooks.
Requirements
- Add your sources
- Data location Workout Wednesday / 2025 / 2025W19 – Can you get your stats sheet? / NHL Postseason Stats 2025-05-06
- Create the following tables in a page called ‘Sources’
- Table 1: All data in NHL Postseason Stats 2025-05-06 data model
- Name: Postseason Data
- Table 2: Only the Team field from NHL Postseason Stats 2025-05-06 (Do not reference the previous element!)
- Name: Team Logos
- Table 1: All data in NHL Postseason Stats 2025-05-06 data model
- Add the team logo URLs to your Team Logos table
- Group by Team
- Create a new calculation called Team Image URL. Use the following formula: “https://a.espncdn.com/combiner/i?img=/i/teamlogos/nhl/500/” & Lower([Team]) & “.png&h=150&w=150”
- This will concatenate the team name into the url that retrieves the team logo from espn.com
- Create a ‘Team’ control that filters the Postseason Data table
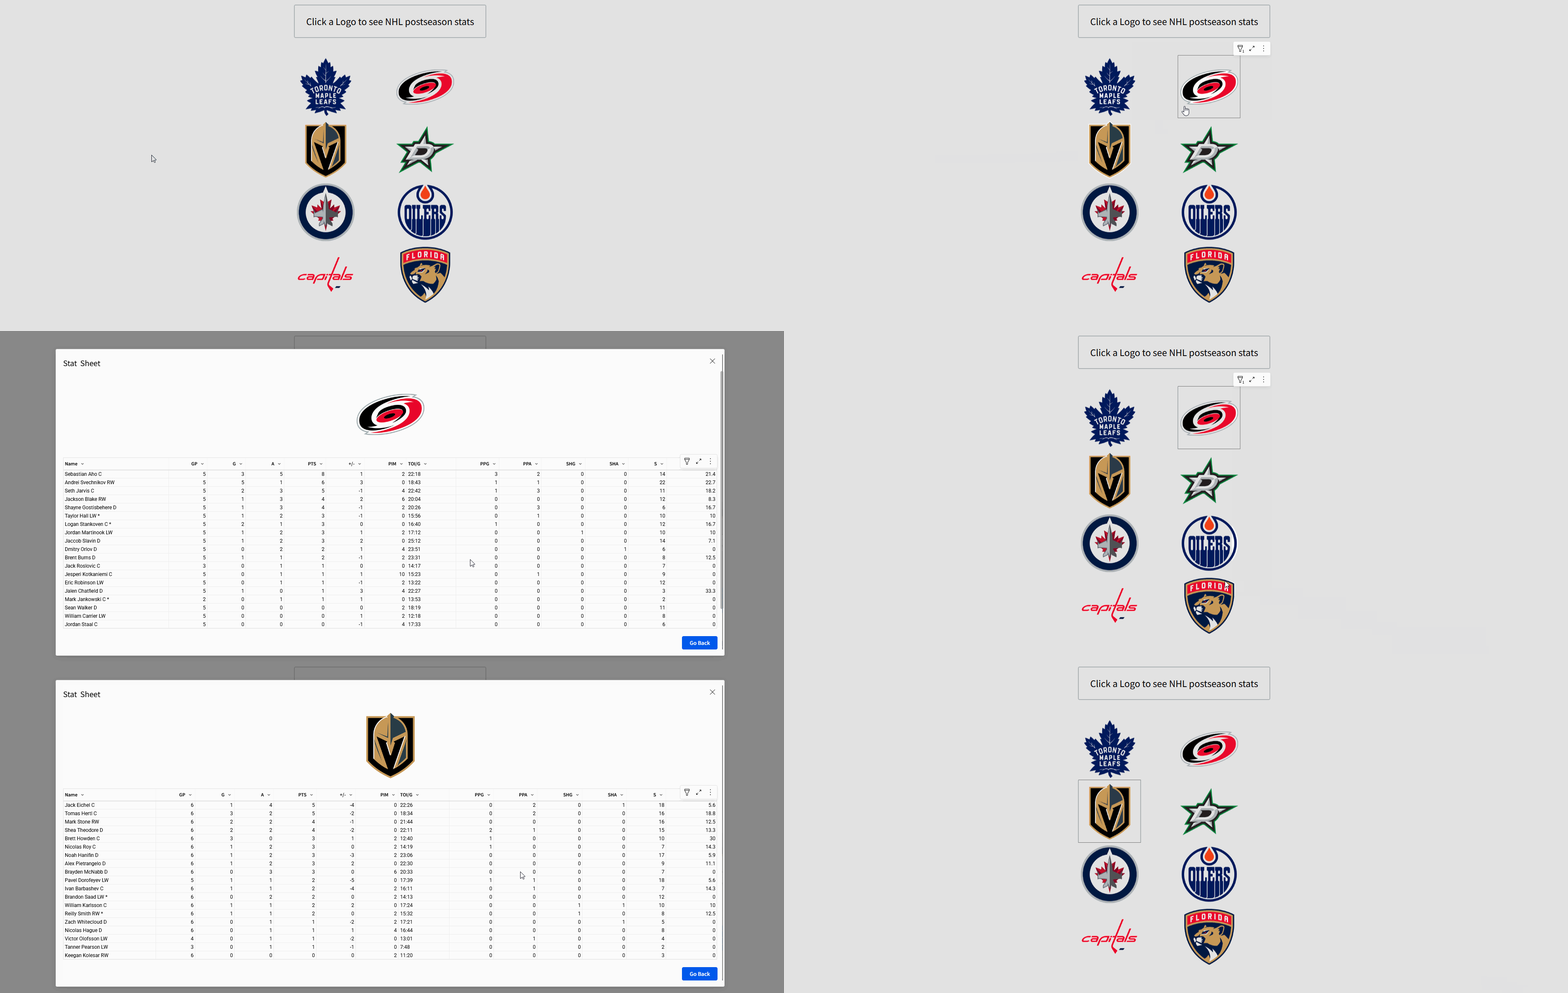
- Display your logos and make them clickable
- Create a new page called ‘Landing’ which is where we’d want users to enter
- Create a new table element from the Team Logos element
- Right click the ‘Team Image URL’ column and select ‘Transform > Set Image
- Turn on ‘Display as image’ and select ‘Original’
- Hit Save
- Filter your logos so there are only 4 of them in one table
- Use a filter on the Team Image URL column
- Select the three dots on the filter, and change the filter type to Top N
- Set this table to display only the Top 4
- Clean up and hide the rest of your table
- Using formatting options, set everything you can to be the same color as the background of the workbook (I chose grey, but you can choose any color that allows the logos to pop)
- Table Header background
- Table Header font
- Table Header divider
- Table Cell background
- Table Element background
- Using formatting options, set everything you can to be the same color as the background of the workbook (I chose grey, but you can choose any color that allows the logos to pop)
- Create a new modal called Stat Sheet to hold your stats
- Create a table element that points back to the Postseason Data on your Sources Tab
- Add an image UI element, using a similar URL to what you had before, but with the ‘Team’ control injected into it: “https://a.espncdn.com/combiner/i?img=/i/teamlogos/nhl/500/{{Team}}.png&h=200&w=200“
- Hide the Secondary button in your modal, and adjust the title and formatting as desired
- Change the Primary button text to “Go Back”
- Add actions to your workbook pages
- Landing
- Each element that contains team logos should have an action that does the following
- On select:
- Set ‘Team’
- Open a modal (Stat Sheet)
- Stat Sheet
- On click – primary
- Close Modal
- On close
- Close Modal
- On click – primary
- Landing
- Add your sources
Dataset
Tables and Datasets / Workout Wednesday / 2025 / 2025W19 – Can you get your stats sheet? / NHL Postseason Stats 2025-05-06
Share
After you finish your workout, share on LinkedIn, Sigma’s Community page, (or Twitter) using the hashtags #WOW2025 and #SigmaComputing, and tag Ashley Bennett, Eric Heidbreder, Katrina Menne, and Carter Voekel!
Create an interactive, sharable version of your solution here.
Also, make sure to fill out the Submission Tracker so that we can count you as a participant this week to track our participation throughout the year.
Solution
Coming Soon!
