2025 Week 22 | Sigma: Do You Modal?
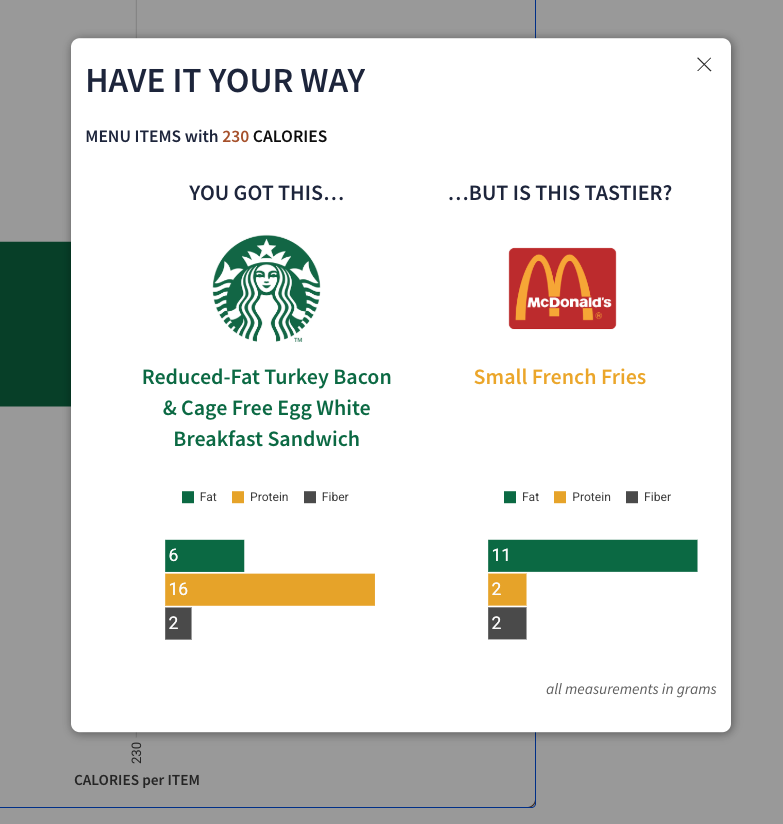
Can you create a modal? Introduction Think a bran muffin is a healthier choice than a breakfast sandwich? Think again. This week’s challenge throws Starbucks and McDonald’s into the ring — matching menu items with the same calorie count but wildly different nutritional makeups. Spoiler: one of them is a lentil bowl, the other is …