Introduction
【EN】
Welcome to the second week of the Community Month! I bring a challenge inspired by Chiaki (@ishiaki_tab)! Chiaki has been a Tableau Visionaries since 2024 and a key leader in Japan TUG.
Chiaki was also the winner of the Viz Games at the Salesforce World Tour Tokyo 2024, and this week’s challenge is inspired by the techniques she showcased there. This challenge surely expands your Tableau toolbox. Now I hand it over to Chiaki:
I’m honored to have the opportunity to contribute to this week’s WOW challenge!
If you’ve seen my workbooks on Tableau Public, you might know that in Viz Games, I used the Dynamic Zone Visibility feature within a single dashboard to dynamically change visualizations and layouts while storytelling – this approach ultimately led me to win the championship.
Most people turn to the Story feature when thinking about storytelling in Tableau. However, since Story requires a fixed dashboard layout, you typically need multiple dashboards to dynamically change layouts or displayed visualizations. To avoid this, I leveraged Dynamic Zone Visibility.
This approach has been demonstrated by past Iron Viz champions like Will Sutton, Paul Ross, and Chris Westlake. It also pairs well with animations, making stories even more compelling. I highly recommend checking out their fantastic work.
To keep the focus on the theme, we have prepared a simple visualization for this challenge. The difficulty level should be approachable, so I encourage you to give it a try!
【JP】
WOWのCommunity Monthということで、みなさんお馴染みChiaki Ishida (@ishiaki_tab)さんとコラボした問題をお届けします。Chiakiさんは2024年からのTableau Visionaryであり、またJTUGでもリーダーシップを発揮されている、Tableauコミュニティの顔とも言える方ですね。
今回はChiakiさんが優勝したViz Gamesでのテクニックをテーマに出題します。以下、Chiakiさんからのコメントです:
WOWの出題テーマに選んでいただけて光栄です!
Tableau Publicにあるワークブックを見たらわかるように、Viz Gamesでは1枚のダッシュボードで動的ゾーン表示機能を使ってVizやレイアウトを変えながらStorytellingを行い、そしてチャンピオンの栄光をいただくことができました。Tableauを使用したStorytellingと言えば、一般的にはストーリー機能を使用すると思います。
ただしストーリーではダッシュボードレイアウトは固定のため、今回のようにレイアウトや表示するVizも変化させたい場合、複数のダッシュボードを作成する必要がありました。これを避けるため、動的ゾーン表示を使用したアプローチを採用しました。このアプローチはWill Sutton をはじめ、Paul Ross、Chris WestlakeなどIron Vizの歴代チャンピオンたちが活用しています。アニメーション機能とも相性が良いので、Storyをより強力に印象づけることができるでしょう。彼らの素晴らしいストーリーも必見です。
今回はテーマに焦点を当てるため、Viz自体は簡単に作れるように二人で用意しました。
取り組みやすい難易度だと思うので、ぜひチャレンジしてみてください。
Requirements
【EN】
- Dashboard Size: 1400 x 800 px
- Create a parameter to control what is displayed, allowing the dashboard to show the following items:
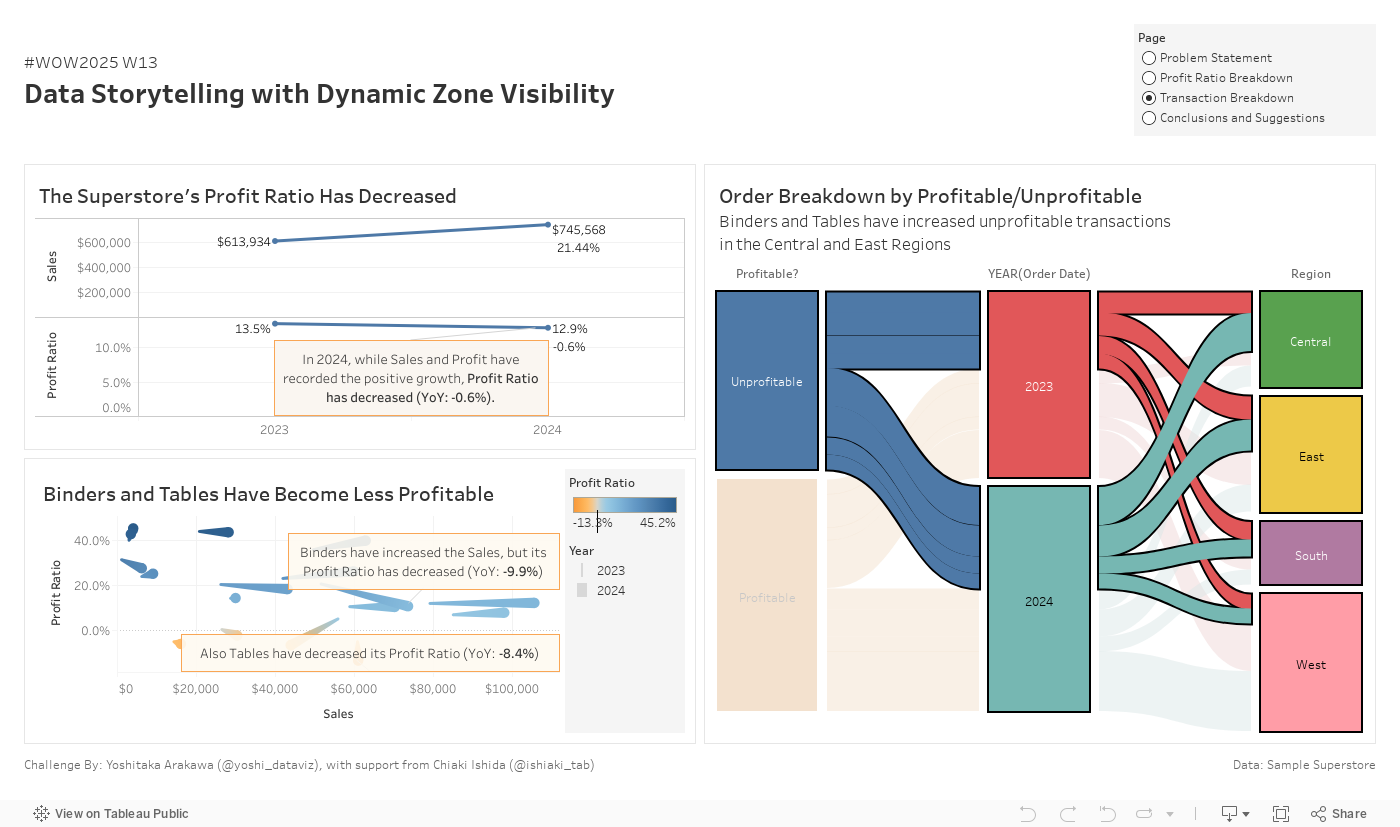
- A chart showing the sales and profit ratio trends for 2023 and 2024 (include an annotation indicating the YoY change).
- A Comet Chart displaying the sales and profit ratio trends by sub-category for 2023 and 2024 (include annotations indicating each YoY change).
- A Sankey Diagram categorizing order records by whether profit is negative, order year (2023 & 2024), and region.
- Filter by Tables and Binders Sub-Categories.
- Using Viz Extensions is recommended.
- Conclusions and suggestions.
- You can write your own message if you want.
- Match tooltips and formatting as much as possible.
【JP】
- ダッシュボードサイズ:1400 x 800 px
- 何を表示するかをコントロールするためのパラメーターを作成し、パラメーターの値に応じて以下を表示できるようにする:
- 2023年と2024年の売上と利益率の推移(注釈を記載し、また利益率のYoYを表示すること)
- サブカテゴリごとの、2023年と2024年の売り上げと利益率の推移を表すComet Chart(注釈を記載、また利益率のYoYを表示すること)
- 利益が0以下のレコードかどうか、オーダー年(2023年と2024年)、Regionで区分されたSankey Diagram
- サブカテゴリーのフィルターを入れ、テーブルとバインダーでフィルターする
- Viz Extensionsを使用することをオススメします
- 結論と提案
- 好きなように記載いただいても大丈夫です。
- ツールヒントや見た目をできるだけ一致させる。
Dataset
This challenge uses Sample Superstore data (2024 version) with no filters applied. You can find the data source on Data.World (log-in to data.world required).
Attribute
When you publish your solution on Tableau Public make sure to take the time and include a link to the original inspiration. Also include the hashtag #WOW2025 in your description to make it searchable!

Share
- On Twitter using the hashtag #WOW2025 #Tableau and tag @WorkoutWednsday, @ishiaki_tab, and @yoshi_dataviz
- On LinkedIn using the tag Workout Wednesday, Tableau, Chiaki Ishida, and Yoshitaka Arakawa
Solution
Interactive