Introduction
Happy New Year!
For those of you who like to set goals, I hope we can help you level up your skills in Tableau this year. This first month, our aim is to bring you challenges that are accessible to everyone who feels they are at a Beginner to Intermediate level. We hope you can dive into these each week, dedicating a little of your time to learning new things and building your Tableau Public portfolios.
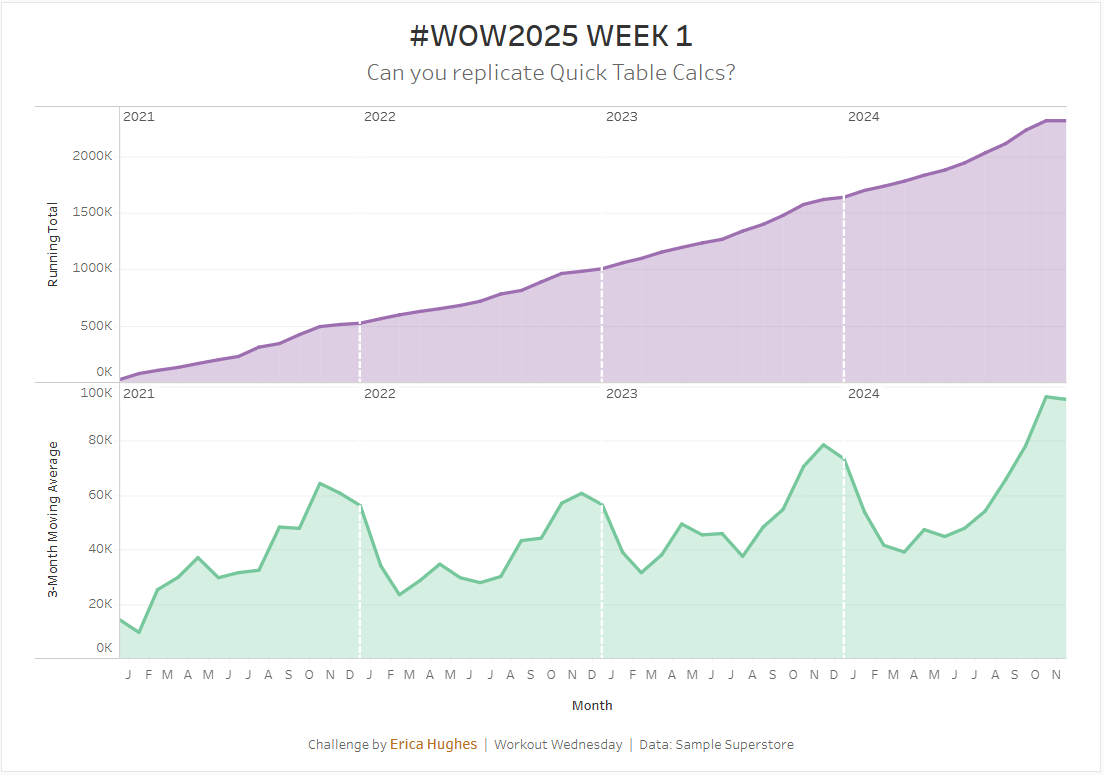
To kick things off, this week we ask you to build two charts without using Quick Table Calcs. Have fun and don’t forget to share your solutions with us online!
Requirements
Dashboard Size 1000 x 700
One worksheet
- Two calculations
Restrictions:
No Quick Table Calcs
- No Running_Sum( ) function
Create two area charts that produce:
- A Running Total of Sales by Month
- A 3-month Moving Average of Sales by Month, including the 2 previous months + the current month
- Match tooltips and formatting (colors: #a16eaf & #67c79c)
Dataset
This challenge uses Sample Superstore data (2024 version) with no filters applied. You can find the data source on Data.World
Attribute
When you publish your solution on Tableau Public make sure to take the time and include a link to the original inspiration. Also include the hashtag #WOW2025 in your description to make it searchable!

Share
After you finish your workout, share your solution:
- On Twitter using the hashtag #WOW2025 #Tableau and tag @WorkoutWednsday and @_hughej
- On LinkedIn using the tag Workout Wednesday, Tableau, and Erica Hughes
