Introduction
This week’s challenge is inspired by Robbin Vernooij & Lorna Brown’s talk from Tableau Conference this year (TC25) titled ‘Taming the Beast: Normalization Strategies in Tableau’
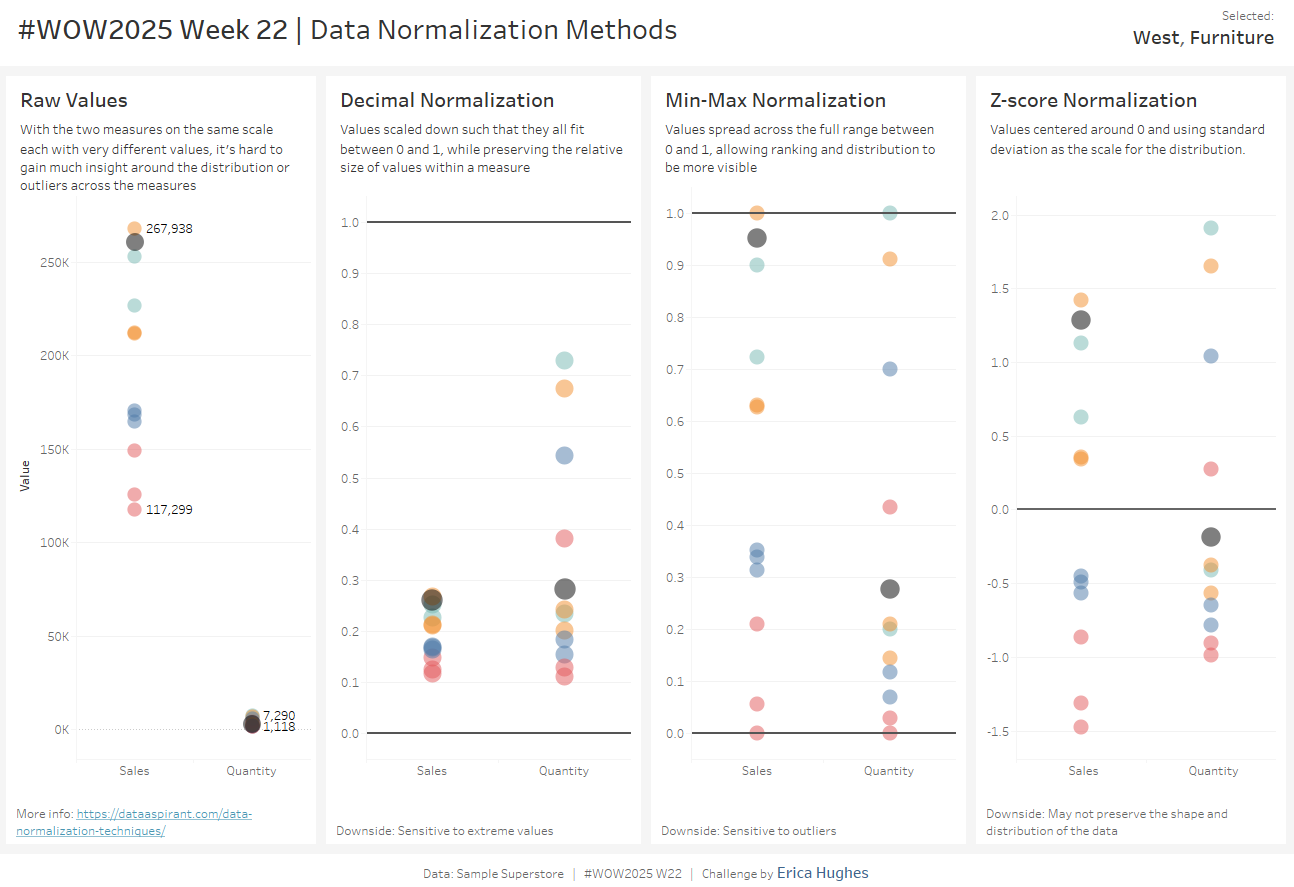
Normalization allows us to examine the relative importance of values that may be on completely different scales.
A common example of where we use normalization is when we compare statistics across countries, since these can vary widely across all metrics: land area, GDP, populations, etc. For example, when considering Birth Rate, we recognize the variety in Total Population, and so we define it as N births per 100,000 people in order to be able to make valid comparisons across countries.
In this challenge, you will be calculating three different Normalization Methods and seeing how each can bring a new perspective to our understanding of the data.
If you need help with the calculations, I recommend this website: https://dataaspirant.com/data-normalization-techniques/
Requirements
Dashboard Size 1300 x 900
Level 1 – create the ‘Raw’ chart
Create a dot plot that includes Sales and Quantity in the same chart.
- Color by Region
- Each dot represents a specific combination of Region + Category
- Match tooltips and formatting (text elements are optional)
Level 2 – create all the charts
Complete Level 1, and…
- Create 3 more charts (you can use this website for help with the calculations needed):
- Decimal Normalization
- Min-Max Normalization
- Z-score Normalization
- Add reference lines, as shown
- Match the layout, tooltips and formatting
Level 3 – add interactivity & details
- Complete Level 1 & 2, and…
- Allow the user to select a specific circle on any chart
- The selected circle should stand out with a bold color (I used black) and sligthly larger size.
- The selected Region + Category should be highlighted everywhere in every chart
- The selected Region + Category should appear as text in the top right corner of the dashboard
- Disable Tableau’s default highlighting
Dataset
This challenge uses Sample Superstore data (2024 version) with no filters applied. You can find the data source on Data.World
Attribute
When you publish your solution on Tableau Public make sure to take the time and include a link to the original inspiration. Also include the hashtag #WOW2025 in your description to make it searchable

Share
After you finish your workout, share your solution:
- On Twitter using the hashtag #WOW2025 #Tableau and tag @WorkoutWednsday and @_hughej
- On LinkedIn using the tag Workout Wednesday, Tableau and Erica Hughes
Solution
Interactive
