Introduction
In this week’s challenge, we’re going to recreate a very small part of Kathryn McCrindle’s (Linked In / X ) #TC25 Iron Viz.
Kathryn is a colleague of mine at Biztory, and made it through to the Iron Viz final at TC25 in San Diego. In 20 minutes, she built this impressive suite of dashboards based on the FAA wildlife strike data.
I’m using this week’s #WOW2025 challenge to showcase a small part of her viz – the damage cockpit and incorporate some of the techniques used by the finalists to help save themselves time. There is absolutely no expectation to complete this in 20 minutes! Or within any timeframe for that matter 🙂
The Iron Viz finalists receive the data set a few weeks before the final, and so have time to analyse and prepare the data and ultimately build out their final viz. Kathryn used Tableau Prep to reshape the data for her needs. I have provided a very much simplified version of the data, restricted just to the strikes from 2023, and just the fields relevant for this part of the build.
The dataset provided contains the following fields
- Strike ID [integer] – identifies a specific wildlife strike incident that was recorded
- Part [string] – the location the plane was hit
- Struck? [boolean] – true indicates the part was struck during the incident
- Damaged? [boolean] – true indicates the part was damaged during the incident
- Substantially Damaged and Part Damaged [boolean] – true indicates the part was substantially damaged during the incident
- Strike ID – Is Struck [integer] – if the part was struck, the Strike ID is captured in this field
- Strike ID – Is Damaged [integer]- if the part was damaged, the Strike ID is captured in this field
Requirements
- Size 1000 x 900
- 1 sheet
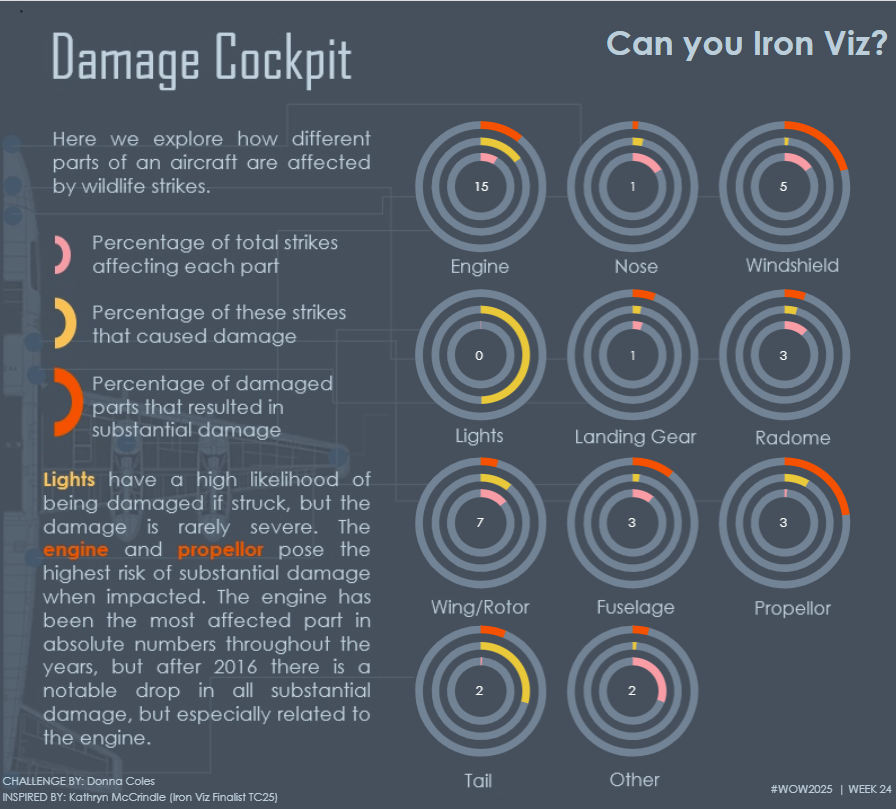
- Build a display of concentric circles for each part, with each part positioned as per the solution :
- Inner ring- Of all incidents, the proportion of those that involved a strike to the specific part vs those that didn’t (True: #ff9da7, False #708395)
- Middle ring- Of the incidents that struck the specific part, the proportion of those where damage was recorded (True: #edc948, False #708395)
- Outer ring – of the incidents that struck the part and where damage recorded, the proportion marked as substantially damaged (True: #ff5300, False #708395)
- Label the centre of the circles with the number of times the part was substantially damaged
- Add a tooltip only on the centre circle detailing the count relating to each layer (this wasn’t part of the original viz)
- Make sure you can’t select any of the other circles/rings
- Don’t adjust any fonts – import the included custom theme (json file).
- You will need to be using v2025.1 to use this – if you can’t access this version, you can still build the viz but you’ll have to apply some of the formatting manually.
- Use the provided image to apply all the background imagery/text
- note as we’re not including all the information on the original dashboard, the verbiage refers to information we’re not displaying.
Dataset
The curated data set and associated files are all accessible from here.
Attribute
When you publish your solution on Tableau Public make sure to take the time and include a link to the original inspiration. Also include the hashtag #WOW2025 in your description to make it searchable!

Share
After you finish your workout, share on Twitter and/or LinkedIn using the hashtag #WOW2025 #Tableau and tag @WorkoutWednsday
Solution
Interactive
