Introduction
This week’s challenge was inspired by a question from a colleague. They were looking for ideas for how to manage a chart with multiple lines and mulitple metrics.
My colleague started with the idea of highlighting a single line in each chart, to show how the company compared to its competitors – a simple parameter highlight. The stakeholders, however, asked for every line to have its own colour, such that they could more easily see how their company compared with a specific competitors across the various metrics.
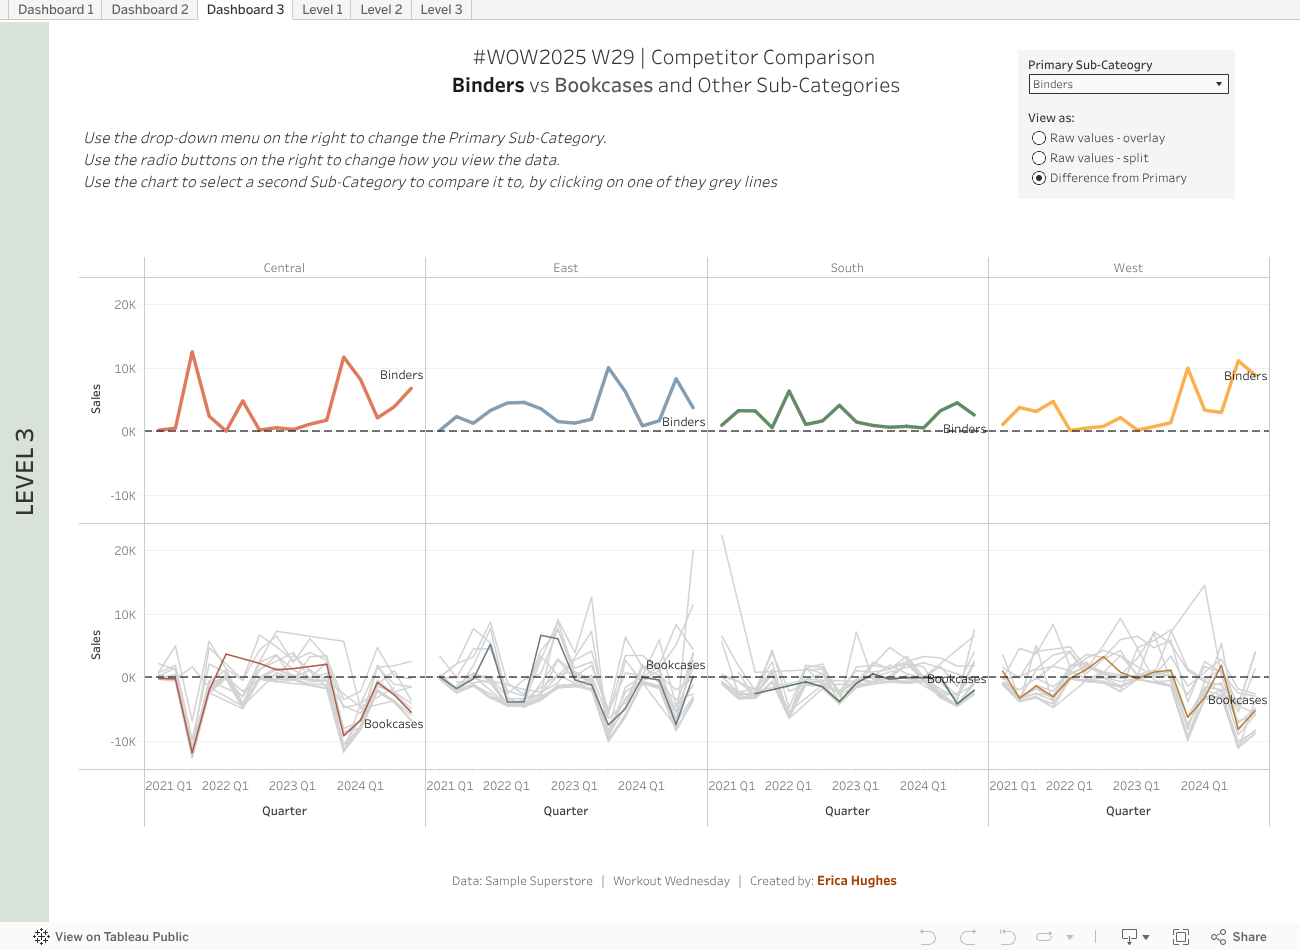
My idea for how to avoid a completely overwhelming number of colours on the page was to create something like the solution to this challenge. In this chart, we highlight one line for “our company” (aka: Highlighted Sub-Category) and allow the user to select a secondary “company” (aka: Sub-Category), bringing attention to just two lines at any time.
Additionally, given that the stakeholders were interested in comparison, I decided to play with the idea of changing the metric of all the ‘Other’ “companies” (aka: Sub-Categories) to a ‘Difference’ calculation. This chart may be harder to interpret, but with some understanding, I think it really clearly shows peaks & troughs which are less clear when only looking at the raw values.
Overall, I think it’s the combination of all 3 versions of the same data which allow users to get the most well-rounded perspective of their data – hence the ability to swap between all of the views.
Requirements
For all levels:
- Dashboard 1300 x 900
- Only one sheet allowed
- Create a line chart of Sales by Quarter, separated by the 4 Regions, with one line for each Sub-Category.
- Match tooltips and formatting
Next, choose 1 difficulty level (they are similar, but all have slightly different requirements that don’t naturally follow on from one to the next)
Level 1 / Beginner
- Allow the user to dynamically highlight a single Sub-Category
- Include the selected Sub-Category in the title.
- Formatting:
- #c85200 for Selected Sub-Category
- #d3d3d3 for Other Sub-Categories
- Ideally, make the Selected-Subcategory stand out even more, using the Size shelf to make it bolder
Level 2 / Intermediate
- Allow users to dynamically highlight a single Sub-Category.
- Change the highlight colour depending on the Region:
- #e07a5f for Central
- #849db1 for East
- #638b66 for South
- #fbb04e for West
- #d3d3d3 for Other Sub-Categories (not highlighted)
- Allow the user to view every Sub-Category on the same axis OR separate the Highlighted Sub-Category from the Other Sub-Categories
- Include the Highlighted Sub-Category in the Title AND the chart Label
Level 3 / Advanced
- Allow users to dynamically highlight a single Sub-Category.
- Change the highlight colour depending on the Region:
- #e07a5f for Central
- #849db1 for East
- #638b66 for South
- #fbb04e for West
- #d3d3d3 for Other Sub-Categories (not highlighted)
- Allow the user to change between 3 views:
- 1: All Sub-Categories on the same axis
- 2: Selected Sub-Category on a separate axis compared to the Other Sub-Categories
- 3: Selected Sub-Category on one axis, showing raw sales values. Other Sub-Categories on a different axis showing the Difference in Sales compared to the Selected Sub-Category.
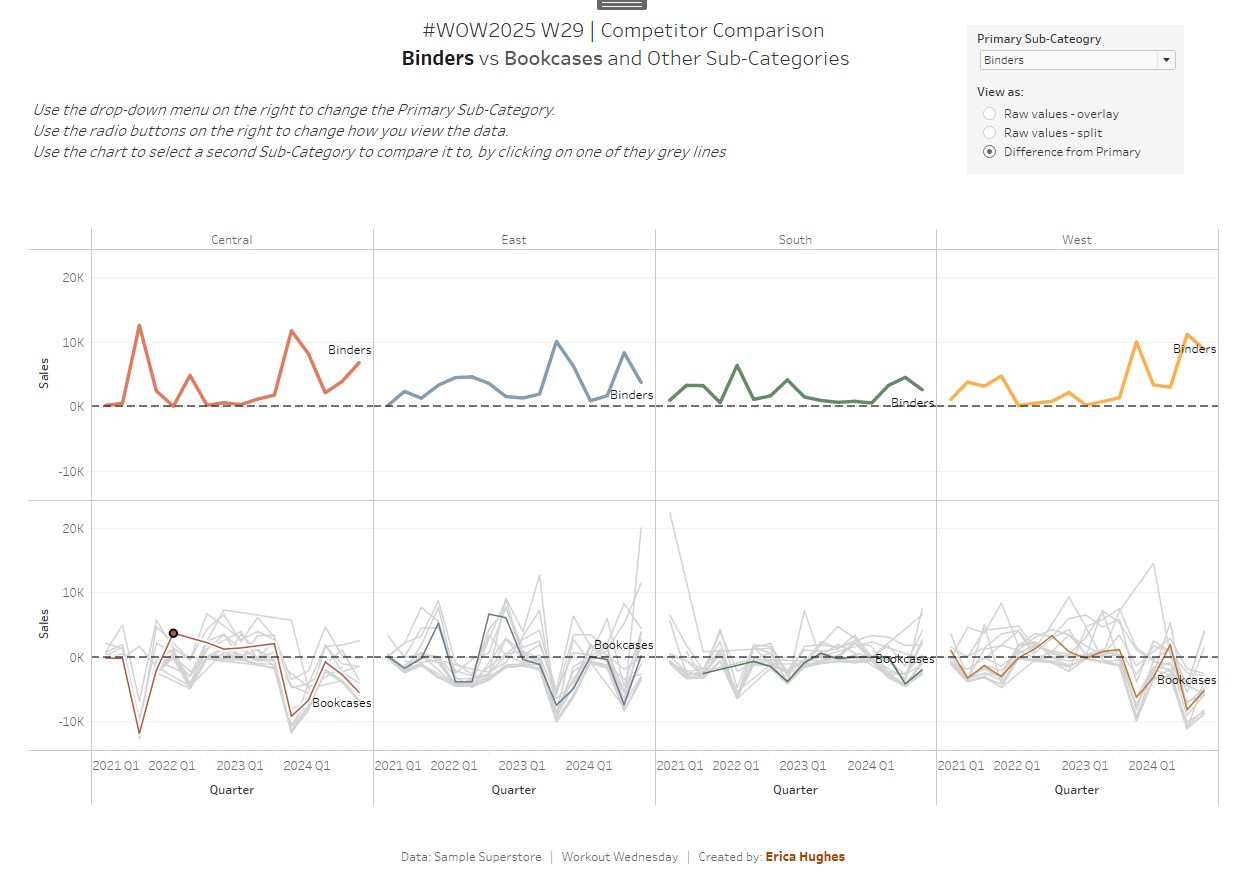
- Allow the user to select and highlight a Secondary Sub-Category by clicking on a line in the chart. The Secondary Sub-Category should remain highlighted in all 3 versions of the view.
- Include the Primary and Secondary (if selected) Sub-Categories in the chart Title and the Labels.
- Make sure the tooltip reflects the different measures used for the Primary Sub-Category (ie: Sales) vs the Other Sub-Categoires (ie: Difference from Primary Sub-Category Sales).
- Match all other tooltips & formatting
Dataset
This challenge users Sample Superstore data. You can download the data here.
Attribute
When you publish your solution on Tableau Public make sure to take the time and include a link to the original inspiration. Also include the hashtag #WOW2025 in your description to make it searchable!

Share
After you finish your workout, share on Twitter and/or LinkedIn using the hashtags #WOW2025 #Tableau and tagging:
On LinkedIn: Erica Hughes & Workout Wednesday
On Twitter: @_hughej & @WorkoutWednsday
Solution
Interactive