Introduction
I am truly honored to continue serving as your coach and supporting your learning this year.
My first challenge in 2025 is about an exploratory dashboard.
Have you ever created a dashboard that allows users to explore data step by step, from an overview to detailed information?
In many cases, this can be achieved using filters or filter actions. However, depending on the granularity of the data or the perspectives users want to analyze, simply filtering the same type of chart may not be sufficient. In such cases, different charts may be required.
One approach to address this is to split the dashboard. However, this can lead to multiple dashboards with similar designs, which might increase the cost of layout and design maintenance.
Alternatively, you can create a single dashboard that dynamically changes the displayed charts based on the granularity of the data or filter conditions. This approach not only reduces the need for users to navigate across multiple dashboards but also makes the experience more intuitive.
In this challenge, we will learn how to implement this method by creating a simple dashboard. Have fun!
Requirements
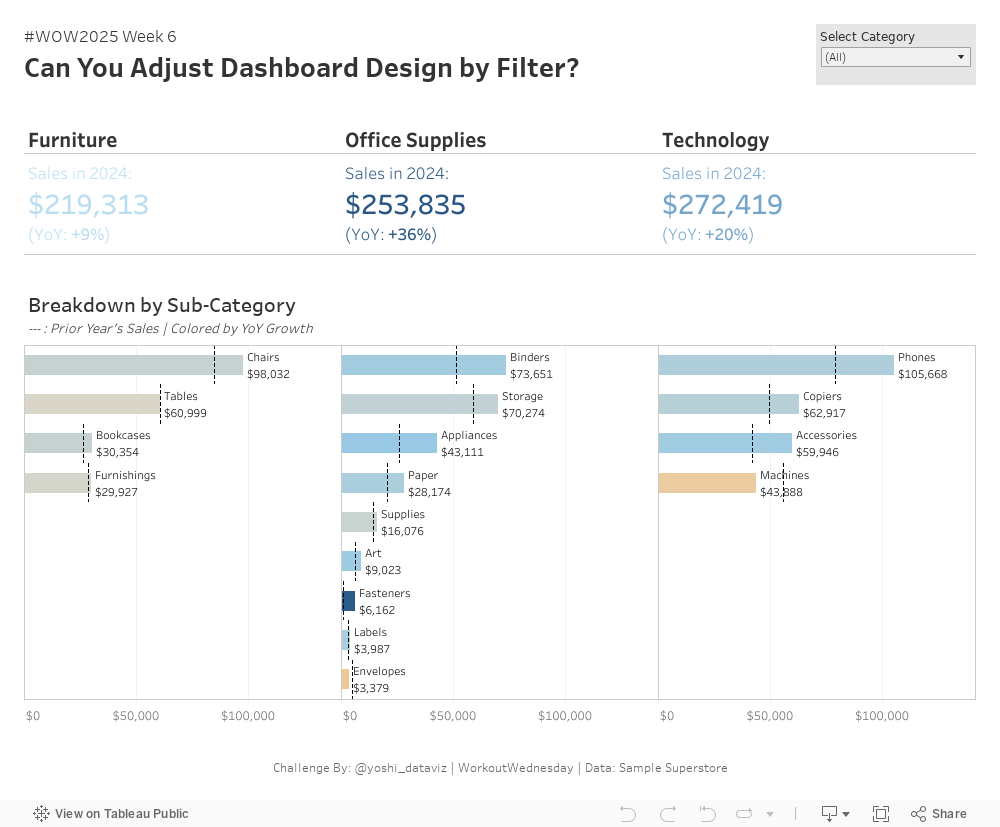
- Display the total Sales in 2024 and the year-over-year growth rate by Category.
- Make bullet charts comparing Sales in 2024 (bar charts) and 2023 (dashed lines) by Sub-Category.
- Add a Category filter.
- Display the bullet chart by product name only if not all of the Categories are selected in the filter.
- Color all of the charts with their YoY.
- Match tooltips and formatting as much as possible.
- Dynamic Zone Visibility is the key. Please feel free to do some investigations if you are not familiar with it.
- A boolean required for the DZV must be unique in the data source. You may usually use a parameter, but a FIXED LOD calculation is necessary in this challenge.
- The “filter” in the dashboard is actually not a dimension filter. For hints and inspiration, you can refer to Marc Reid’s article.
- Interestingly, some calculation approaches seemingly satisfy the criteria for DZV but don’t work. See this article‘s “Examples of Invalid Calculations” and “Examples of Valid Calculations” sections in case you have trouble.
Dataset
This challenge uses Sample Superstore data (2024 version) with no filters applied. You can find the data source on Data.World (log-in to data.world required).
Attribute
When you publish your solution on Tableau Public make sure to take the time and include a link to the original inspiration. Also include the hashtag #WOW2025 in your description to make it searchable!

Share
- On Twitter using the hashtag #WOW2025 #Tableau and tag @WorkoutWednsday and @yoshi_dataviz
- On LinkedIn using the tag Workout Wednesday, Tableau, and Yoshitaka Arakawa
Solution
Interactive