Introduction
As we near the end of 2024, I have one last BIG challenge for you all. In the new year I plan to hit reset and get back to fundamentals. If you’re looking to take a break for the holidays, I hope you can come back to this head scratcher when you’re ready.
This challenge was, once again, inspired by my colleague. Their client wanted to be able to have a filter where if a specfic value was selected, then only that category would be displayed – this particular category was described as a sort of ‘Total’ so if any other categories were selected at the same time, then the measures displayed would be innacurate due to duplication of data.
I started by building a quick solution for my colleague that I believed achieved what she was describing, however, the problem stuck with me and took some time to see if I could get Tableau to replicate this behaviour of filtering for *one thing* OR *all other things*.
You will find both solutions included below: the first is challenging, and the second is a challenge on top of a challenge! Approach with caution (and excitement)
Requirements
- 800 x 500px
- 1 sheet
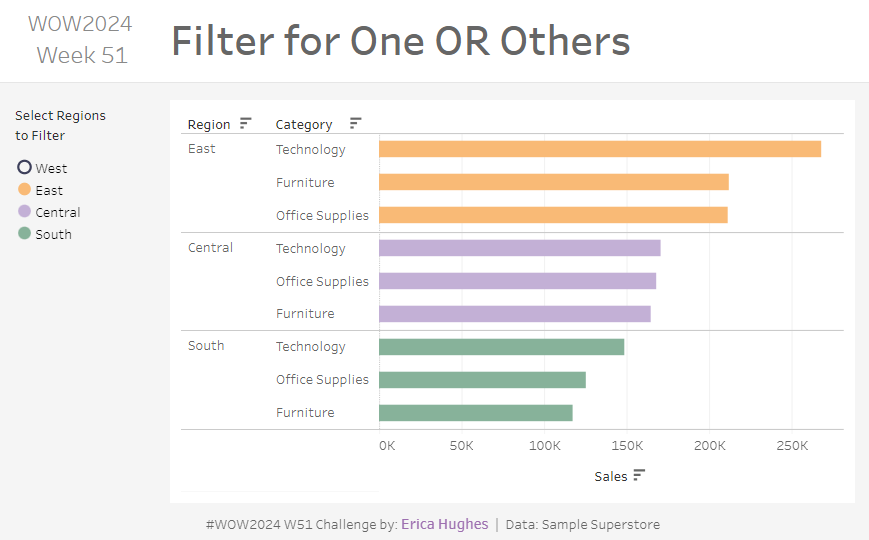
- Create a bar chart of Sales by Region and Category
- Colour the bars by Region (Central #c5b0d5, East #ffbb78, South #81b29a, West #3d405b)
- Sort the bars in descending order by Sales
- Create a parameter to allow the user to select whether they want to view the West Region or All Other Regions (Not West)
- If ‘West’ is selected then only the West region should be displayed in the bar chart
- If ‘Not West’ is selected, then a second ‘filter’ should appear to allow the user to select which regions they want to view from the three that remain (Central, East, South)
HINT: If you completed #WOW2023 Week 9 then this uses a simillar logic. If you want to check out that solution, I recommend Rosario Gauna’s which you can download from here
Version 2 / Bonus Challenge
- Create a bar chart of Sales by Region and Category
- Colour the bars by Region (Central #c5b0d5, East #ffbb78, South #81b29a, West #3d405b)
- Sort the bars in descending order by Sales
- Create a custom filter to allow the user to select which regions they want to see.
- If ‘West’ is selected then only the West region should be displayed in the bar chart. In addition, the custom filter ‘radio button’ should only be filled for the ‘West’ region.
- If any other region is select (Central, East or South) then the ‘radio button’ for ‘West’ should automatically be turn off and users should be able to select and deselect from the three remaining regions. The regions displayed in the bar chart should match the selection in the in the custom filter.
Dataset
This challenge uses Sample Superstore data (2024 version) with no filters applied. You can find the data source on Data.World
Attribute
When you publish your solution on Tableau Public make sure to take the time and include a link to the original inspiration. Also include the hashtag #WOW2024 in your description to make it searchable!

Share
After you finish your workout, share your solution:
- On Twitter using the hashtag #WOW2024 #Tableau and tag @WorkoutWednsday and @_hughej
- On LinkedIn using the tag Workout Wednesday, Tableau and Erica Hughes
