Introduction
In this challenge, we will explore the Multi-Fact Relationship Data Model feature introduced in the 2024.2 version. This feature enables us to seamlessly connect and analyze multiple fact tables within a single data source. It’s exciting as a Tableau datasource can behave like a small database!
Here are some materials for those who are unfamiliar with the feature.
– Diverse Analytics Using Tableau Multi-Fact Relationship (TC25 Session Record)
– When and How to Use Multi-fact Relationships in Tableau (Product Blog)
Here’s a little secret – I hadn’t touched the feature until I built this challenge. But once I did, I realized it’s both easy to set up and super fun. Hope you have a great time learning!
Requirements
- Size: 1000 x 850 px
- Build a data model where the Checkouts and Sales are base tables.
- UNION the Sales Q1-Q4 sheets.
- Create a scatter plot showing the average monthly sales and checkouts by books. Make the awarded titles have a star shape.
- Allow a user to select a book on the scatter plot to show its details:
- Book title, author, and genre.
- Rating distribution with a comparison to other books.
- Monthly sales and checkout trends.
- Copies by libraries; make sure all libraries are always shown.
- Match tooltips and formatting as much as possible.
The required data model is something like this:
Dataset
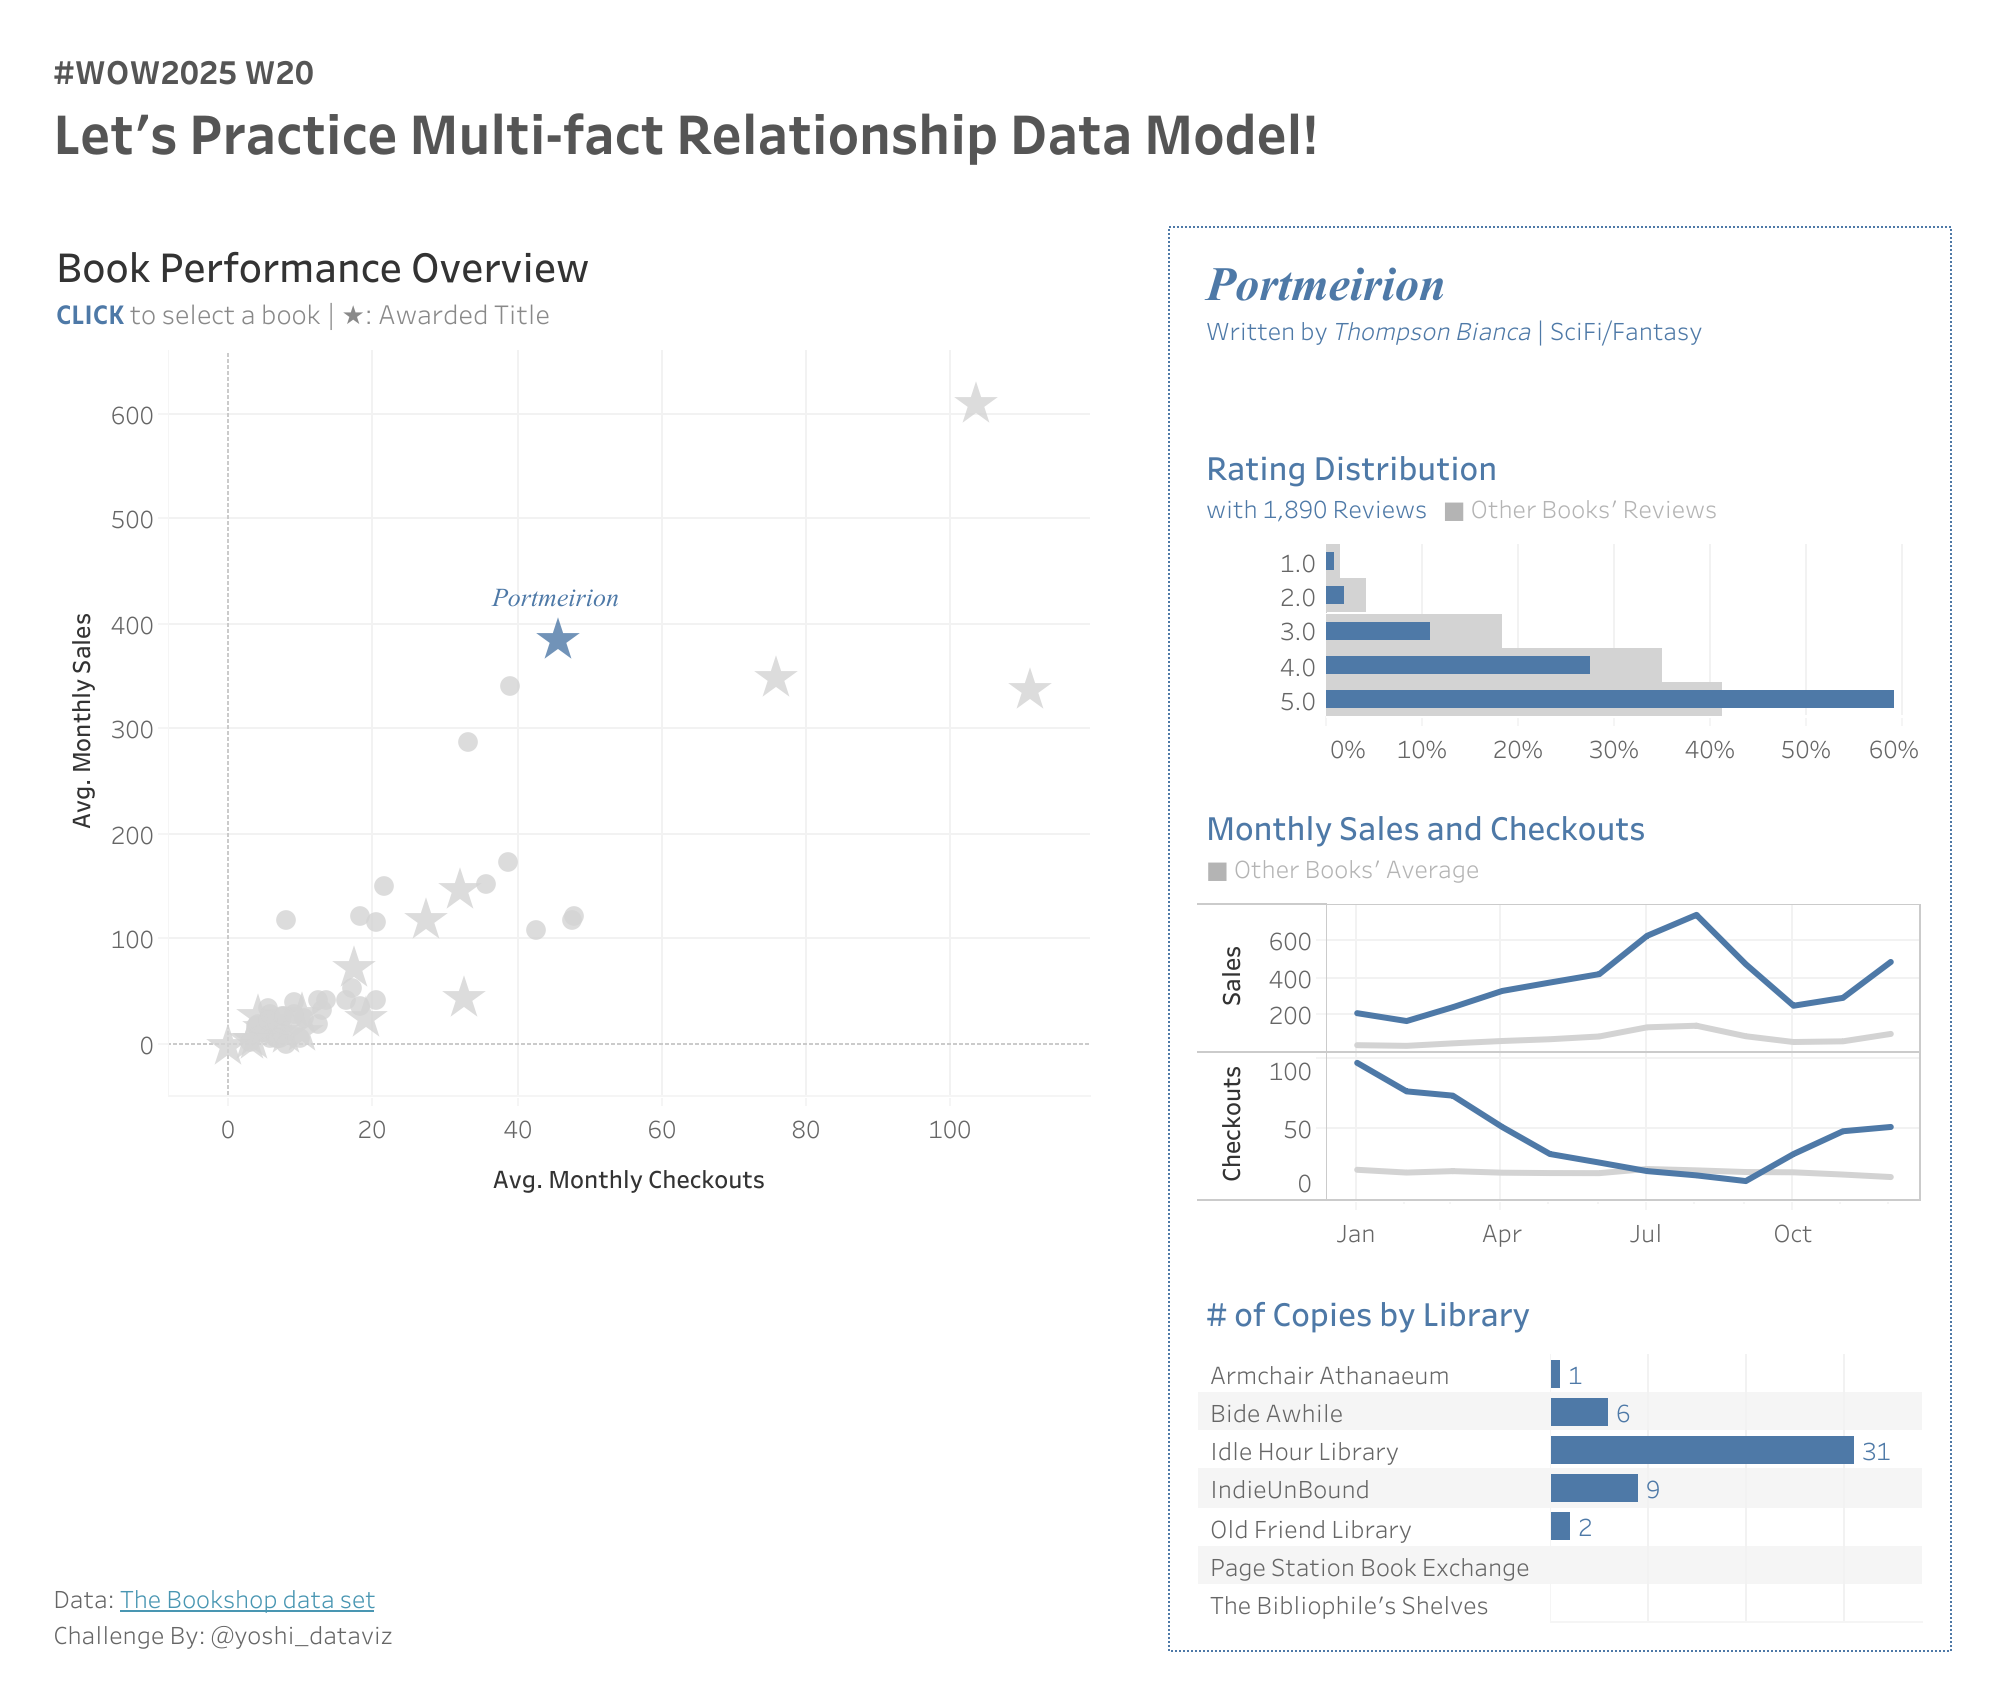
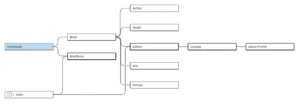
This challenge uses The Bookshop data set and a simple dummy data (Month.csv) available here (Google Drive). Make sure to go through the diagram on the dataset description page to understand the correct relationship keys.
Attribute
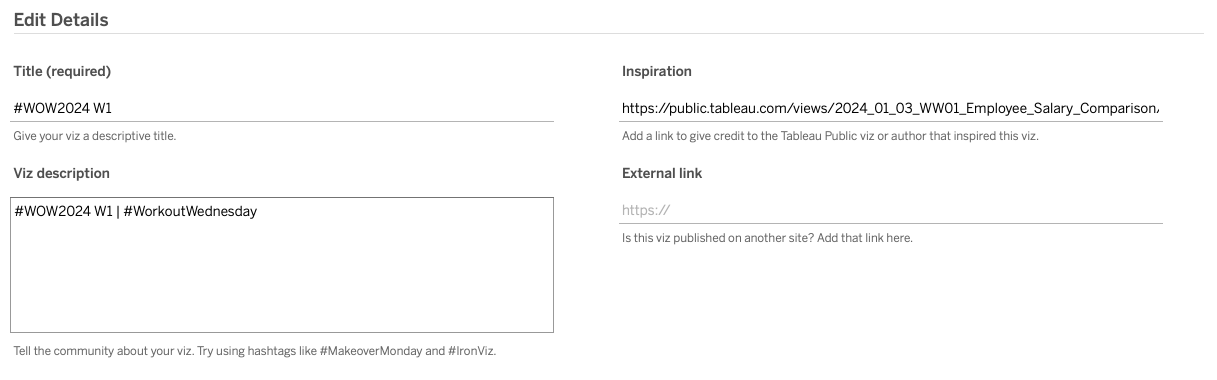
When you publish your solution on Tableau Public make sure to take the time and include a link to the original inspiration. Also include the hashtag #WOW2025 in your description to make it searchable!

Share
- On Twitter using the hashtag #WOW2025 #Tableau and tag @WorkoutWednsday and @yoshi_dataviz
- On LinkedIn using the tag Workout Wednesday, Tableau, and Yoshitaka Arakawa