Introduction
This week challenge features actions that allow users to update multiple rows in an input table at once using formulas / filters. Let’s get to it!
Need access to Sigma?
Note: You will only have view access to WOW Workbooks, Folders, and Workspaces, not edit access. Please create your WOW Workbooks under “My Documents.” We suggest creating a folder to organize all your workbooks.
Requirements
- Create your pages
- Sources, Input Table, Transformations, Charts
- Get your data
- Workspaces / Workout Wednesday / 2025 / 2025W43 – Can you Update Multiple Rows? / 2025W43 – Food Truck Data Model
- Add this data model to a ‘Sources’ tab
- Sources
- Add a control on the Date column, move it to the ‘Charts’ page. This should target the Food Truck Orders element
- Create a child element from the Food Truck Orders element in our workbook. Call it ‘Food Truck Orders – Filterable’. We’ll use this later to filter down control values without impacting our actual data source.
- Input Table
- Create a Linked Input Table from the Sources > Food Truck Orders element
- Set the key as Menu Item Id
- Add the following columns to the table: Truck Brand Name, Menu Item Name (MENU_ITEM), Item Category, Cost of Goods Usd
- Add a new input column Cost of Goods Override, make it a numeric column
- Create a Linked Input Table from the Sources > Food Truck Orders element
- Transformations
- Add a table element called Food Truck Orders – Add Calculations
- Source should be Sources > Food Truck Orders
- Create 4 new columns
- Cost of Goods Override: Lookup([Cost of Goods Override/Cost of Goods Override], [Menu Item Id], [Cost of Goods Override/Menu Item Id])
- Cost of Goods Adjusted: Coalesce ([Cost of Goods Override (Cost of Goods Override)], [Cost of Goods Usd])
- Profit: [Price] – [Cost of Goods Usd] * [Quantity]
- Adjusted Profit: [Price] – [Cost of Goods Adjusted] * [Quantity]
- Format the columns, as needed
- Charts
- Create the necessary charts
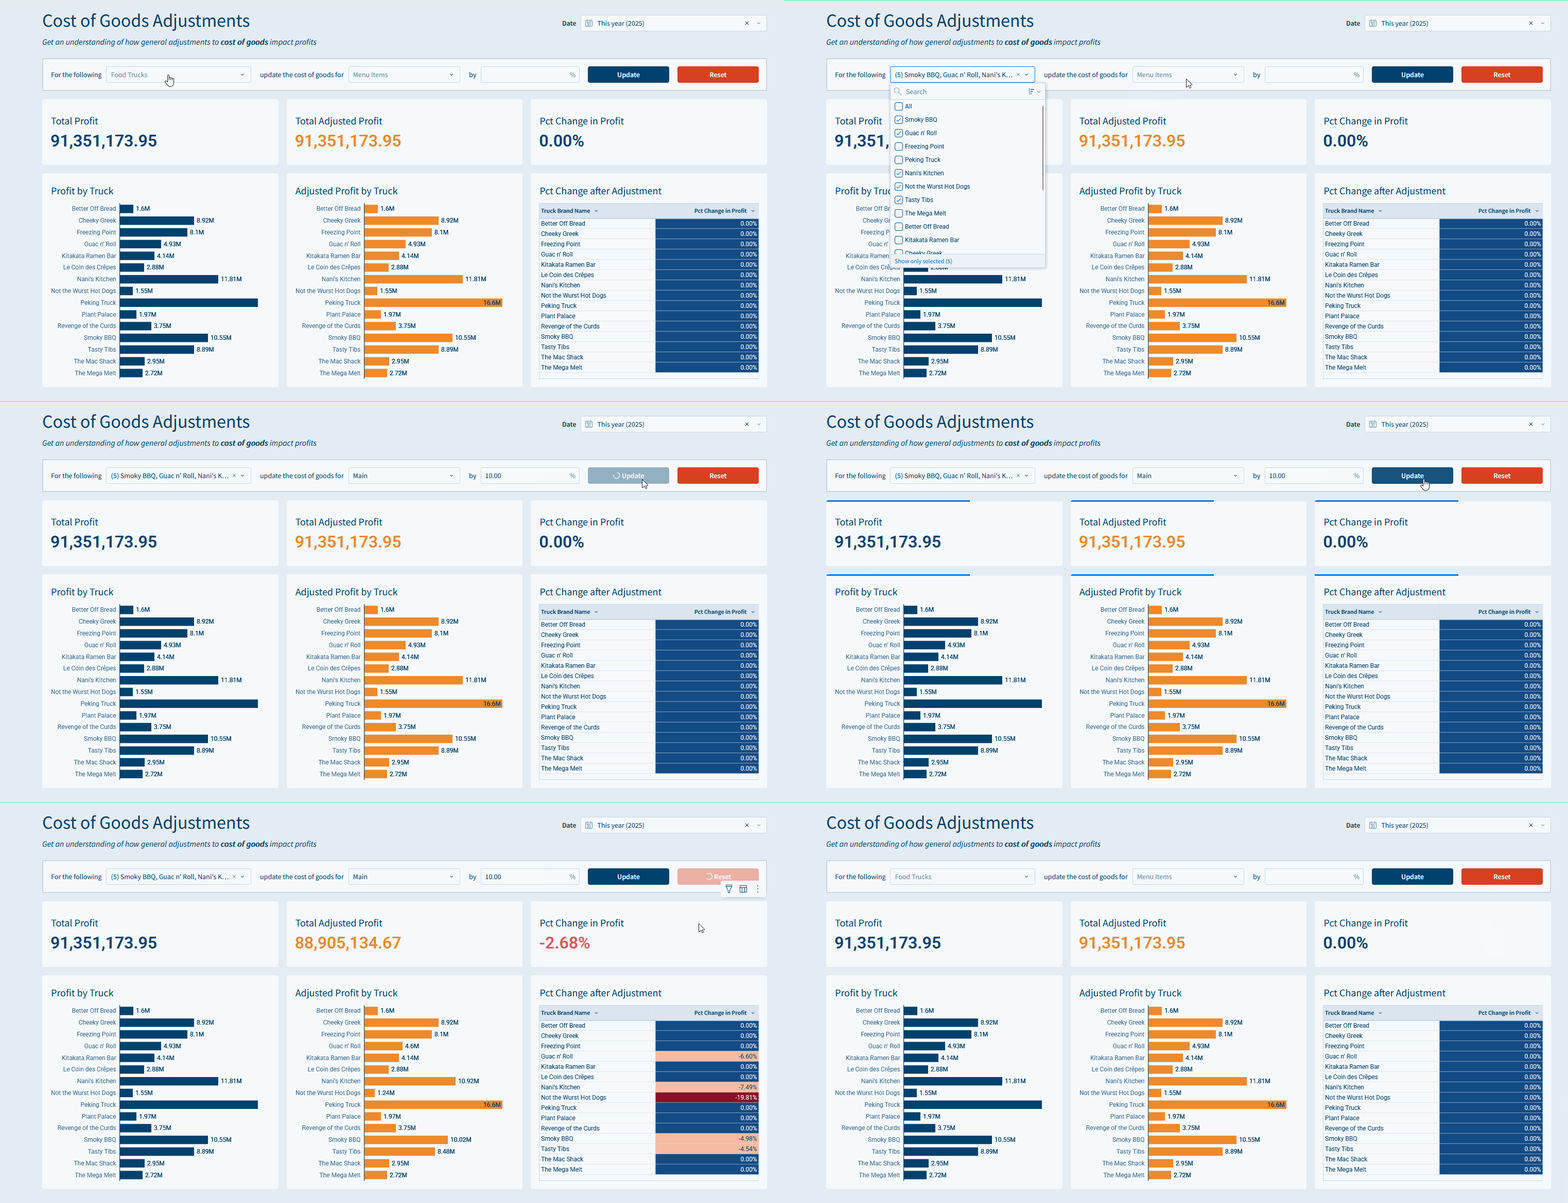
- KPIs – Total Profit, Total Adjusted Profit, Pct Change in Profit
- Pct Change calculated as (Sum([Adjusted Profit]) – Sum([Profit])) / Sum([Profit])
- Bar Charts
- Profit by Truck
- Adjusted Profit by Truck
- Table
- Pct Change after Adjustment
- Group by Truck Brand Name
- Add a new calculation in the group, Pct Change in Profit: (Sum([Adjusted Profit]) – Sum([Profit])) / Sum([Profit])
- Pct Change after Adjustment
- KPIs – Total Profit, Total Adjusted Profit, Pct Change in Profit
- Create a new container to hold all the ‘Update’ options
- Add a “list values” control for Truck Brand Name that gets its values from Sources > Food Truck Orders > Truck Brand Name
- Update the control ID to Truck-Brand-Name
- Change the target to Food Truck Orders – Filterable > Truck Brand Name
- Update the formatting, and change the label to ‘For the following’
- Change the label position to Left
- Under Format > Element Style, update the Placeholder text to ‘Food Trucks’
- Add a “list values” control for Item Category that gets its values from Sources > Food Truck Orders – Filterable > Item Category
- Update the control ID to Item-Category
- Remove any targets
- Update the formatting, and change the label to ‘update the cost of goods for’
- Change the label position to Left
- Under Format > Element Style, update the Placeholder text to ‘Menu Items’
- Add a “number input” control for Cost of Goods Percent Change
- Change the Control ID to Percent-Change-Control
- Change the data format to Percent
- Check the ‘Enter value as percentage’ box
- Under format, change the label to ‘by’
- Change the label position to Left
- Add two buttons
- Update – Color this blue
- Reset – Color this red
- Add a “list values” control for Truck Brand Name that gets its values from Sources > Food Truck Orders > Truck Brand Name
- Add actions to the buttons
- Update
- Add Update row(s) action
- In: Cost of Goods Override (Input Table)
- Update row(s) by: Formula
- Contains(ArrayJoin([Truck-Brand-Name], “|”), [Truck Brand Name]) and Contains(ArrayJoin([Item-Category], “|”), [Item Category])
- Update the Cost of Goods Override column by Formula
- [Cost of Goods Usd] * (1 + [Percent-Change-Control])
- Reset
- Add Update row(s) action
- In: Cost of Goods Override (Input Table)
- Update row(s) by: Column value matches criteria
- Cost of Goods Override is not null
- Update with value(s)
- Cost of Goods Override by Formula: [Cost of Goods Usd]
- Note: I tried setting this to ‘Null’, but got an error, this should work, but is likely due to the feature still being developed
- Update
- Create the necessary charts
- Formatting
- Basic formatting has been applied on bar charts, so I won’t cover that
- For the Pct Change after Adjustment table:
- Right click the Pct Change in Profit column and click ‘Conditional Formatting’
- Format Type: Color Scale
- Scale type: Background Color
- Select a Diverging color palette
- Select 4 steps
- Customize domain so the middle value is 0
- Right click the Pct Change in Profit column and click ‘Conditional Formatting’
- Create your pages
Dataset
Workspaces / Workout Wednesday / 2025 / 2025W43 – Can you Update Multiple Rows? / 2025W43 – Food Truck Data Model
Share
After you finish your workout, share on LinkedIn, Sigma’s Community page, (or Twitter) using the hashtags #WOW2025 and #SigmaComputing, and tag Ashley Bennett, Eric Heidbreder, Jessica Batten, and Carter Voekel!
Create an interactive, sharable version of your solution here.
Also, make sure to fill out the Submission Tracker so that we can count you as a participant this week to track our participation throughout the year.
Solution
Coming Soon!
