Introduction
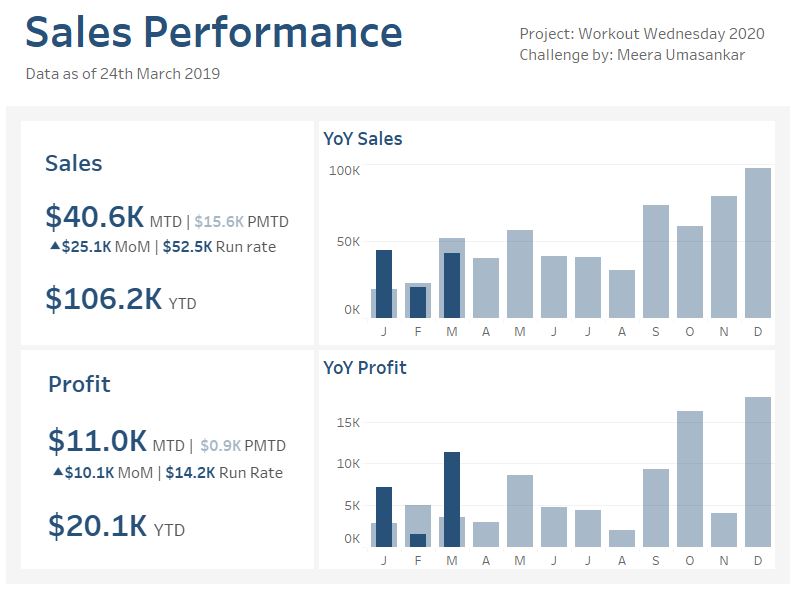
My first WorkoutWednesday challenge for the year! This week let’s create a simple Sales dashboard with some of the key KPI metrics. We will be using the superstore data set showing how the Sales and Profit are performing.
Requirements
- Dashboard Size: 800px by 600 px
- # of Sheets – 3 or less
- Create 2 KPI cards on the left showing
- Sales MTD, Sales PMTD, MoM, Run Rate, YTD
- Profit MTD, Sales PMTD, MoM, Run Rate, YTD
- MTD – Month to date
- PMTD – Previous Month to date
- MoM – Month on month
- YTD – Year to date
- Run rate – Extrapolating current
- Create 2 bar in bar charts
- Sales – Which shows the current year vs previous year comparison
- Profit – Which shows the current year vs previous year comparison
- Formatting
- Match the labels for the metrics
- Sales – this should be expressed as currency, with 1decimal place. Commas should show up for thousands, millions, etc. Same is applicable to PMTD, Run Rate, YTD and MoM
- MoM – show a up or down indicator based on the MoM positive or negative value
- Finishing Elements
- The tooltips for the bars – for the darker blue bars, it should show Jan 19 & the Sales number and the lighter blue bar behind should show Jan 18 & the Sales number. Same with the Profit bars too
- Match colors (more official palette to come, for now you get hex codes)
- Excepts for PMTD all other KPIs: #285179
- PMTD: #a5b6c6
- Labels: #555555
- Match the labels for the metrics
Dataset
This week uses the superstore dataset for Tableau 2020.1. You can get it here at data.world
Attribute
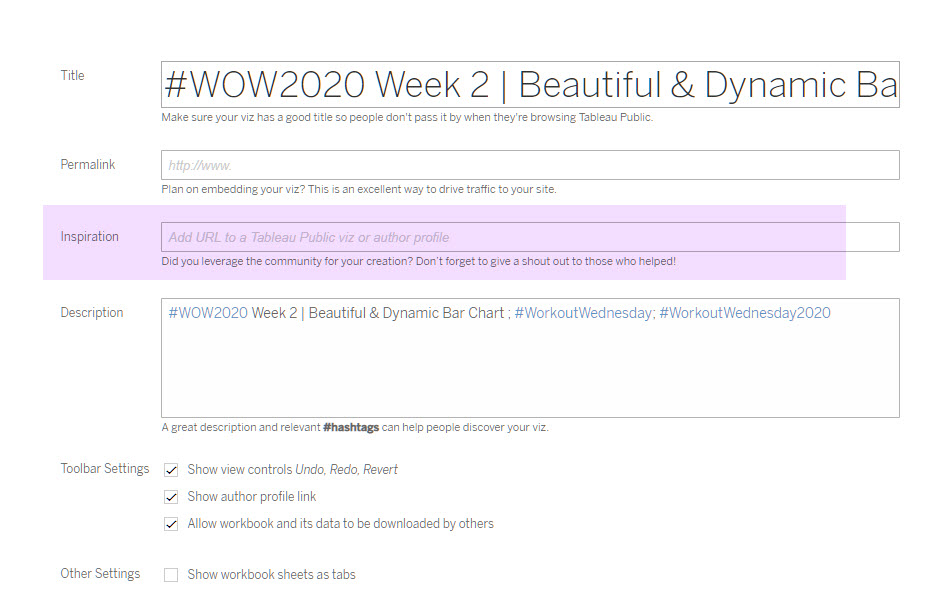
When you publish your solution on Tableau Public make sure to take the time and include a link to the original inspiration. Also include the hashtag #WOW2020 in your description to make it searchable!

Share
After you finish your workout, share on Twitter using the hashtag #WOW2020 and tag @AnnUJackson, @LukeStanke, @_Lorna_Brown and @LosaniMeera
Solution
<!–
–>
