Lorna Brown

2021 Week 20 | Tableau: Can you compare Same Day to a Selected Date?

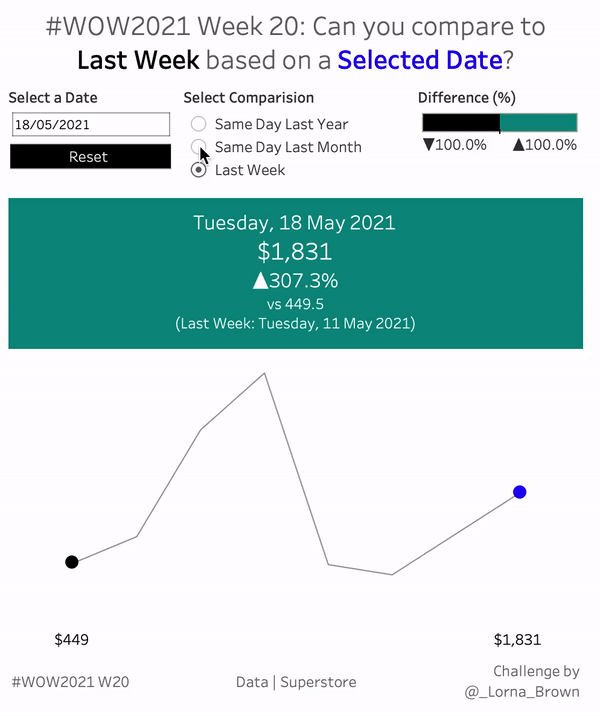
Introduction I came across an interesting challenge. When comparing data, Tableau automatically compares to the same date on the prior month/year etc. But what if you want to compare to the same DAY. For example, Tuesday 18th May 2021, would compare to Tuesday 19th May 2020 for the previous year, and Tuesday 20th April for …

2021 Week 20 | Tableau: Can you compare Same Day to a Selected Date? Read More

2021 Week 16 | Tableau : Can you use Quick LODs to recreate this view?

Introduction With Tableau 2021.1 being released last month, I thought it was time for a challenge. This week we focus in on the new feature of Quick LODs.  Click to open in Tableau Public Requirements Dashboard Size: 800px by 700 px One Sheet Create a dual axis chart which shows the Sub-Category Average Sales by …

2021 Week 16 | Tableau : Can you use Quick LODs to recreate this view? Read More

2021 Week 11 | Tableau : Can you recreate the work of Hans Rosling?

Introduction This week I wanted to throw it back to an old classic chart by Hans Rosling, if you haven’t seen the TED talk I highly recommend watching it. Hans shows how fertility rate and life expectancy has changed over the years. With this example we are going to look at Income per GDP and …

2021 Week 11 | Tableau : Can you recreate the work of Hans Rosling? Read More

2020 Week 7 | Tableau : Can you use Dashboard Extensions?

Introduction Features and functionality on using Tableau and Tableau Public are ever growing. I believe we as WOW have never done this particular object before. Did you know that Tableau has an Extension Gallery? But also did you know that some of the extensions work on Tableau Public?  I never thought about using Extensions on …

2020 Week 7 | Tableau : Can you use Dashboard Extensions? Read More

2021 Week 3 | Tableau : Can you build a Control Chart

Introduction Is it too late now to start the post with Happy New Year?  Well it’s my first Workout of the year so Happy New Year everyone, it’s really great to be back for my third year! After completing the first two workouts from this year (because I suck at Table Calculations), I wanted to …

2021 Week 3 | Tableau : Can you build a Control Chart Read More

2020 Week 39: Can you build a mobile calendar picker?

Introduction Natalia Miteva is responsible for this week’s Community Workout Wednesday Challenge.  Here are all the details in Natalia’s own words: Very excited to share my challenge as part of the Workout Wednesday community contribution month! This week’s workout is inspired by Ludovic Tavernier‘s Date Range Picker viz. The aim of our challenge will be …

2020 Week 39: Can you build a mobile calendar picker? Read More

2020 Week 34: Can you show all the crimes within X miles of Y Point?

Introduction This week, I thought I would do a throwback to a speed tipping session I did in Vegas at Data19. This is using some of the cool spatial techniques. I like to think of this as a target chart, as that’s what it creates. Click to open in Tableau Public Requirements Dashboard Size: 800px …

2020 Week 34: Can you show all the crimes within X miles of Y Point? Read More

2020 Week 31 LIVE: Can you show the top 10 rank over time for each Olympic country?

Introduction For this weeks challenge we are doing a Live collaboration with Preppin’ Data. Where you work through the data prep and then use the outputs to build in Tableau. This is a live event happening on Wednesday 29th July 2020, 4pm BST. The idea of the collaboration allows you to have a look inside …

2020 Week 31 LIVE: Can you show the top 10 rank over time for each Olympic country? Read More

Scroll to Top