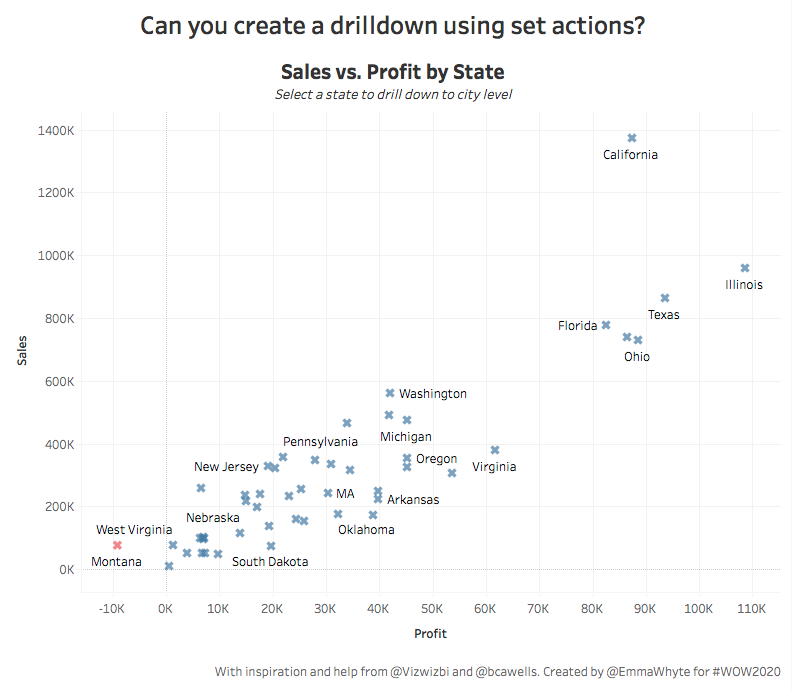
Lorna Brown

Week 43: Show me all the casinos within X miles of X casino by metres

We are on the home run for #Data19, so what better way that to map all the casinos around Mandalay Bay? This week we take a few new features and plot them onto a mobile friendly dashboard. Requirements Dashboard Size 350 x 800 Input custom number of miles Create Map showing selected casino and all …

Week 43: Show me all the casinos within X miles of X casino by metres Read More

Week 39: Can you create a BCG growth share matrix with Sales and Orders?

This week’s #WorkoutWednesday idea comes from creating a product portfolio. The customer wanted to see how much a product has grown and what it’s market share was. We are going to recreate the BCG Growth-Share Matrix for our superstore sub categories and manufacturers. “The BCG Growth-Share Matrix is a portfolio planning model developed by Bruce …

Week 39: Can you create a BCG growth share matrix with Sales and Orders? Read More

Week 35: Drill Down & Up on Sales with Subtotals using Parameter Actions

In the final week of the community challengers we have Rosario Guana. She is a Tableau Ambassador and a Tableau Zen Master. Rosario has been championing WorkoutWednesday since day 1, she writes blog posts about solutions and other tips and tricks in both English and Spanish. When Tableau 2019.2 was launched, I soon found myself testing …

Week 35: Drill Down & Up on Sales with Subtotals using Parameter Actions Read More

2019 Week 31: When #WorkoutWednesday meets #PreppinData? Can you create a Hub and Spoke map?

This week, alongside WorkoutWednesday we have a new collaboration, which gives you a chance to try out another community project,  #PreppinData. PreppinData is a like workoutwednesday but with Tableau Prep Builder. Each week they give you a messy data set, some requirements and a finished data set, you then have to use Tableau Prep Builder …

2019 Week 31: When #WorkoutWednesday meets #PreppinData? Can you create a Hub and Spoke map? Read More

2019 Week 22: X percent of Orders make up X percent of Sales

Ohhhh it’s time for some shiny new features! Parameter actions dropped last week and what a hit they have been! People are republishing their work using the new feature! So I hope you’ve had time to practice them a little bit because we’re about to hit the ground running with them! Click to Interact Requirements …

2019 Week 22: X percent of Orders make up X percent of Sales Read More

2019 Week 15: Tableau Stock Market – How does the stock compare to the overall average or a date selected value?

Sets, Glorious Sets. Was what I tweeted out earlier this week, as I was finishing off my IronViz entry for Europe! Sets and set actions are super powerful and there are so many use cases. This week we take a look at the Tableau Stock market, using the almighty SET ACTIONS, and obviously it includes …

2019 Week 15: Tableau Stock Market – How does the stock compare to the overall average or a date selected value? Read More

2019 Week 7: What gifts do people plan on spending money on?

Valentine’s Day is officially tomorrow. This data set looks at percentage of people buying a particular gift. This week I wanted to focus in on building a few things; using the button functionality, sheet swapping and finally a radar chart (because why not). Many Many people have been waiting for the button functionality and I …

2019 Week 7: What gifts do people plan on spending money on? Read More

Scroll to Top