Luke Stanke

2019 Week 33: 2018 IronViz Finalist Corey Jones’s Table Challenge

This week are excited to continue the community challenge month by welcoming Corey Jones. Based out of Philadelphia, Corey was a 2018 IronViz Finalist and is an avid sports fan. One of the great things that comes with working with a talented team is that you have the opportunity to learn from and push each …

2019 Week 33: 2018 IronViz Finalist Corey Jones’s Table Challenge Read More

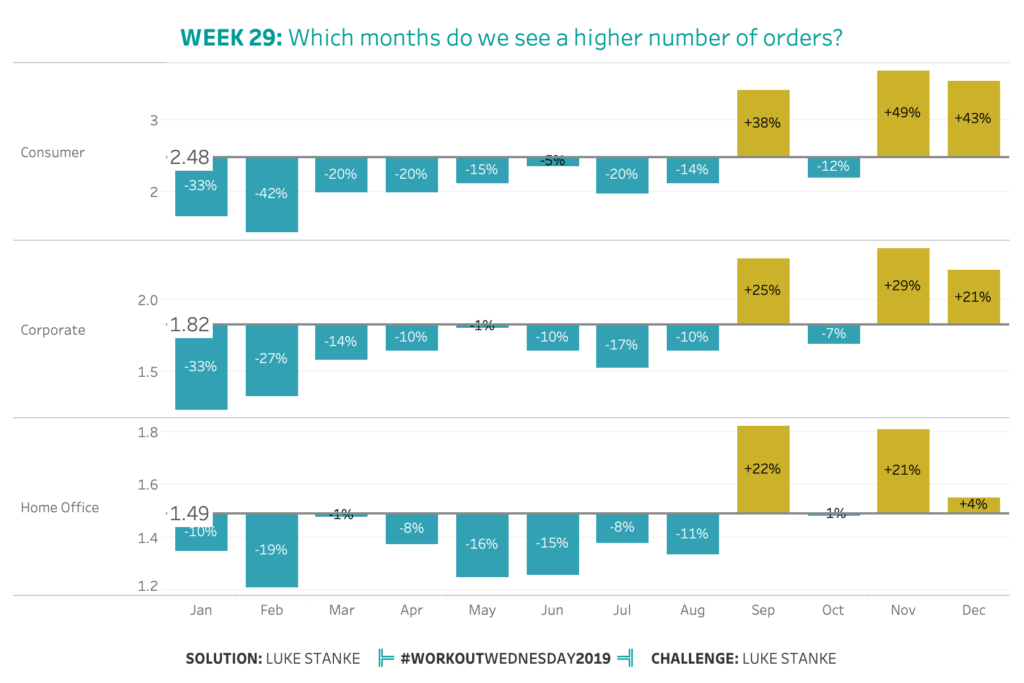
2019 Week 29: Which months do we see a higher number of orders?

Last week we were putting together a deck for an executive team and we wanted to show the seasonality of data while still showing the overall average. In our time crunch we came up with our challenge for this week!p Challenge – Intermediate Click image to view on Tableau Public Requirements – Intermediate Format: 900px …

2019 Week 29: Which months do we see a higher number of orders? Read More

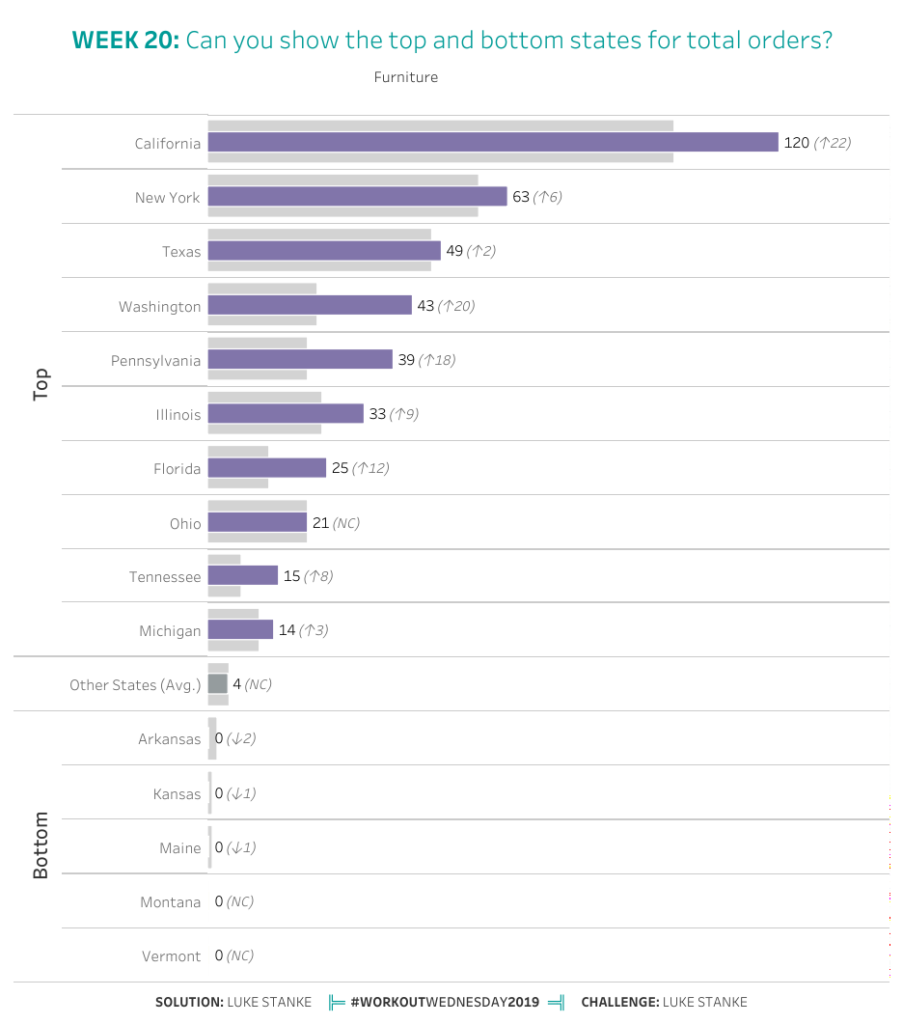
2019 Week 20: Can you show the top and bottom states for total orders

This week Ann and I are doing a live Workout Wednesday for the San Fransisco Bay Area Tableau User Group, so I tried to make sure this challenge can be done in 30 minutes. Challenge Click image to view on Tableau Public Requirements Format: 750px by 850px Create a bar-on-bar chart that shows: A top …

2019 Week 20: Can you show the top and bottom states for total orders Read More

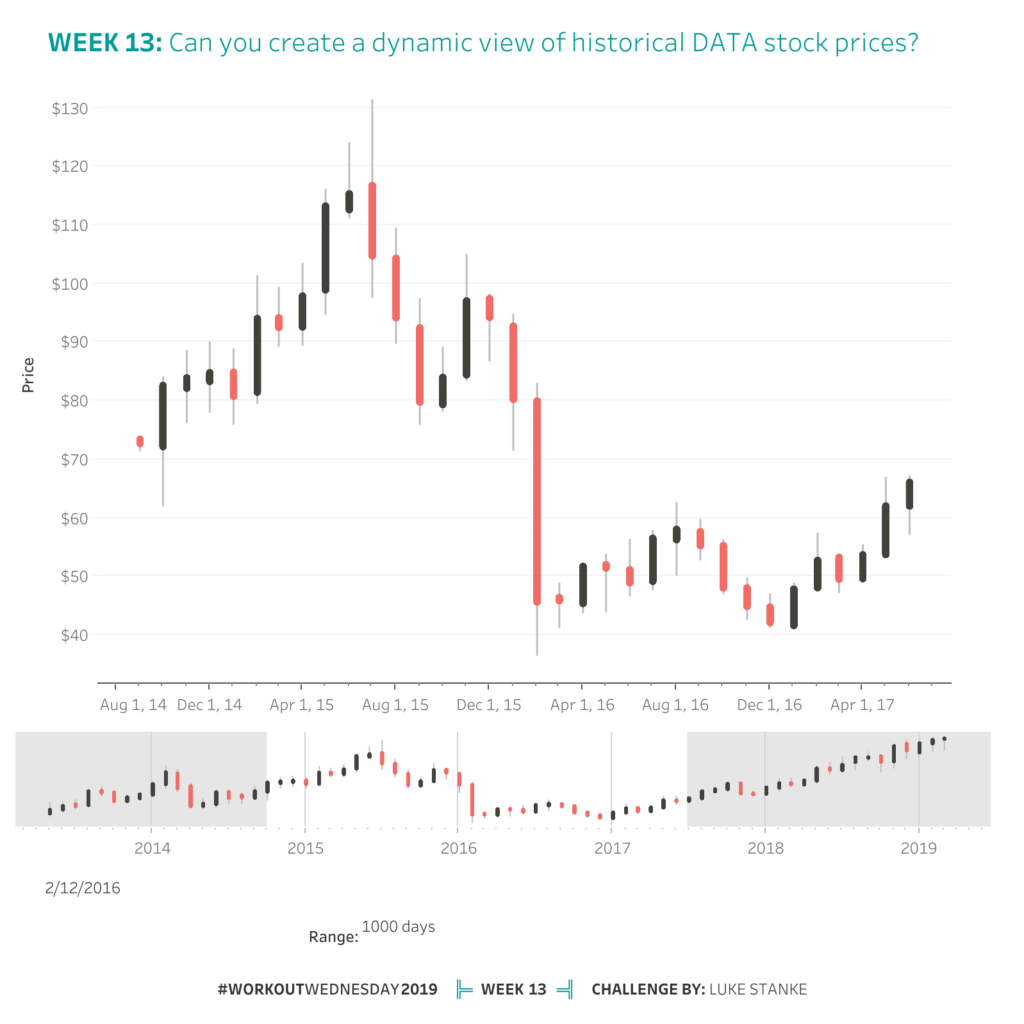
2019 Week 13: Can you create a dynamic view of historical DATA prices?

This week were taking a look at Tableau Stock prices using candlestick charts. So whats different about this? The dates aggregate at differet levels depending on the number of candlesticks! This challenge is not easy so there are 2 achievement levels. You can make this chart using either a gantt chart or by unioning the …

2019 Week 13: Can you create a dynamic view of historical DATA prices? Read More

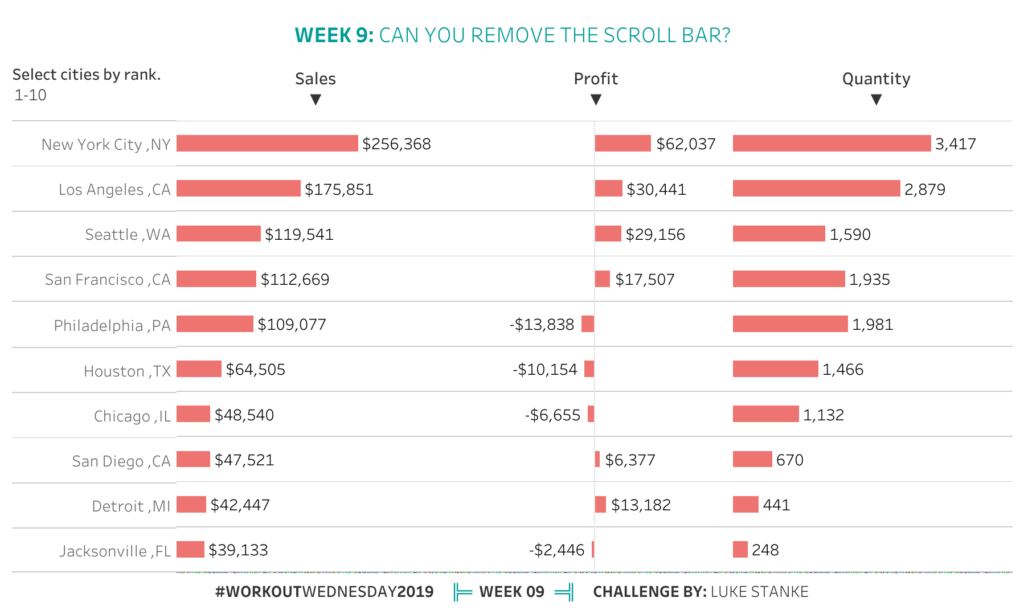
2019 Week 9: Can you remove the scroll bar?

When I started Workout Wednesday I made a list of potential challenges. This challenge was the second challenge I wrote down. After more than 20 challenges I’ve finally gotten around to sharing it! Challenge Click to view on Tableau Public Requirements Format: 1000px by 600px Create a visualization with bar charts that show total sales, …

2019 Week 9: Can you remove the scroll bar? Read More

Scroll to Top