2020 Week 23: Can you excel at bar charts?
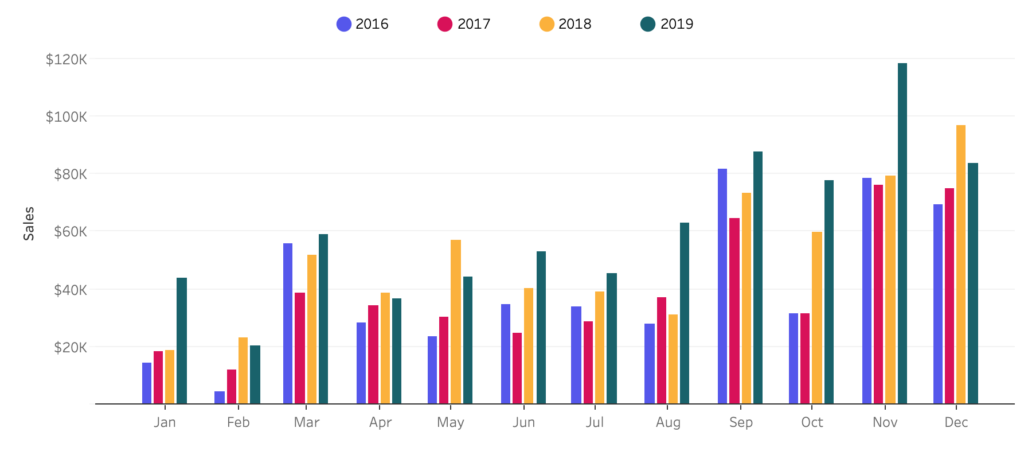
Introduction This week’s challenge is relatively straight-foward: remake a bar chart to look like a Microsoft Excel bar chart. The key to this chart is the extra whitespace between months. Click to open in Tableau Public Requirements Dashboard Size: 900px by 500px Show sales by month for each of the four years. Each bar should …