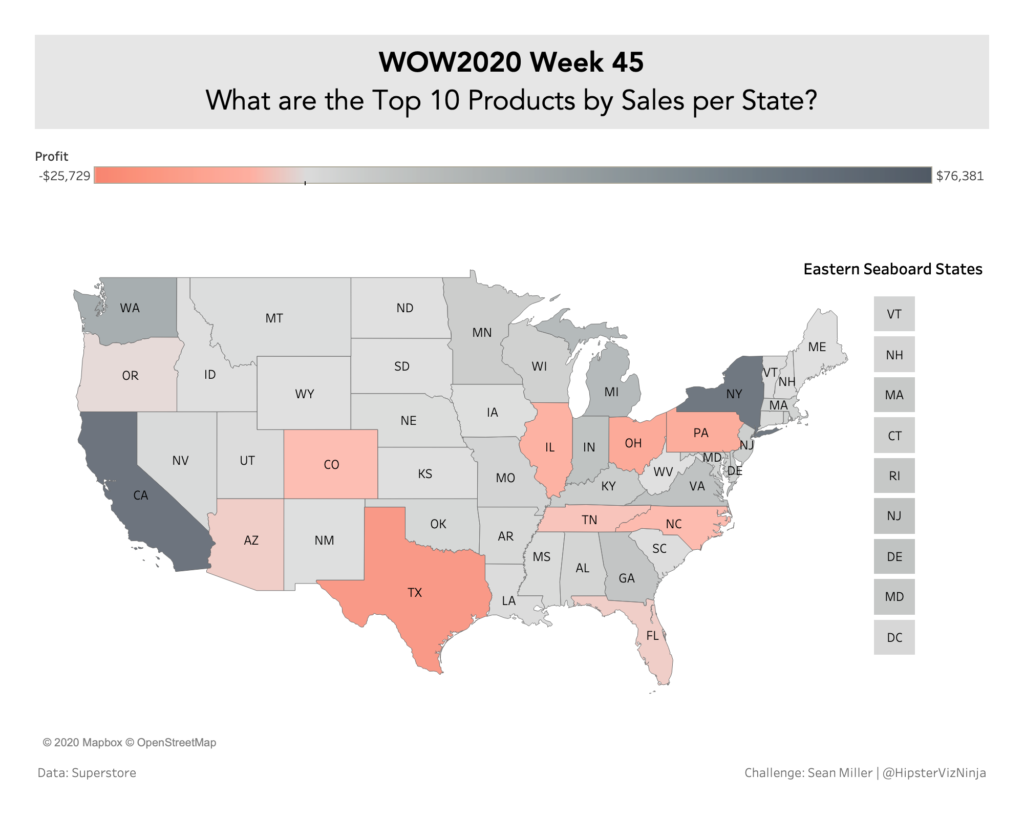
2020 Week 45: Can you show the top 10 products for each state?
How can you use Tableau’s native features to show the top 10 products by sales for each state?
Welcome to Community Month Hey all! It’s Sean and I’M SO EXCITED to be here to kickoff #WOW2020 Community month! Over the course of the next 4 weeks, we’ll be hosting challenges from some incredible community members! For the last 2 two years, we’ve dedicated a month to highlight & promote some incredible members of …
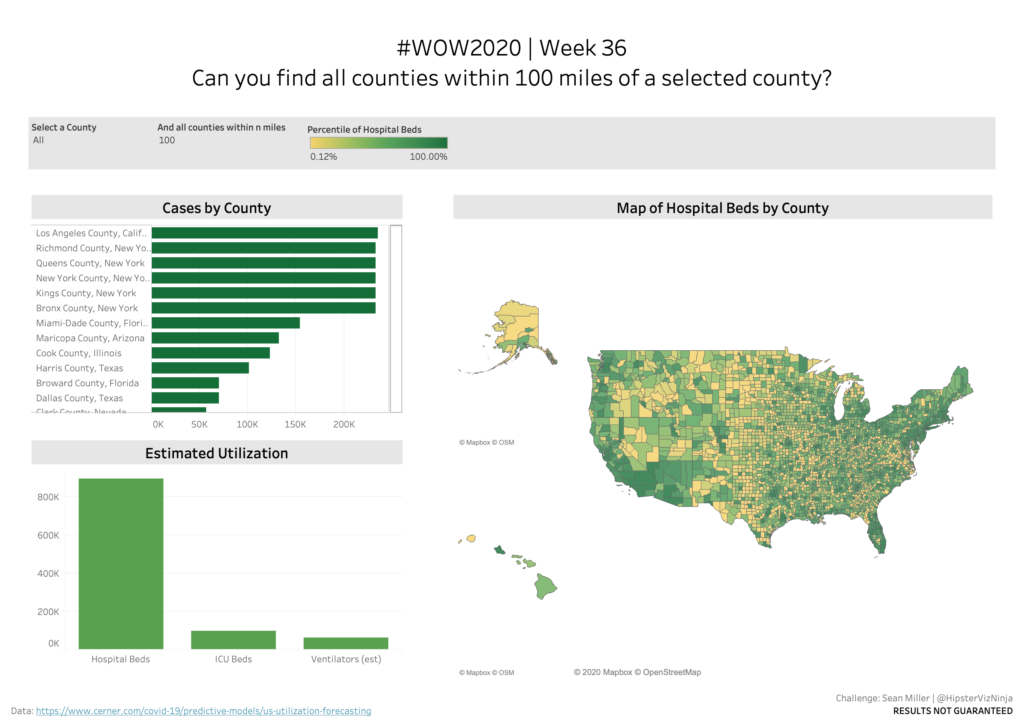
Introduction When I was asked to create a dashboard to help public health offices get a handle on the COVID-19 one of the more interesting challenges I was faced with how to allow the user to search for a particular county and filtering a map to only counties within a specified radius. So that’s what …
WOW2020 | week 36 | Can you find all counties within n miles of a selected county? Read More
Introduction Hi friends! Well, it’s been a quarter since my last challenge so you know what that means, it means we’ve got a new version of Tableau to check out! A couple weeks ago, 2020.3 was released and with it came a whole host of new awesome features and functionality! As always, #WOW2020 is here …
Introduction What’s up #WOWzers! Have you heard the news? Tableau just release a feature-packed release with v2020.2. So many cool new features to try out and the #WOW2020 enjoyed my new feature challenge so much last time, they invited me back to do a challenge for this release too! One new feature that I’d been looking …
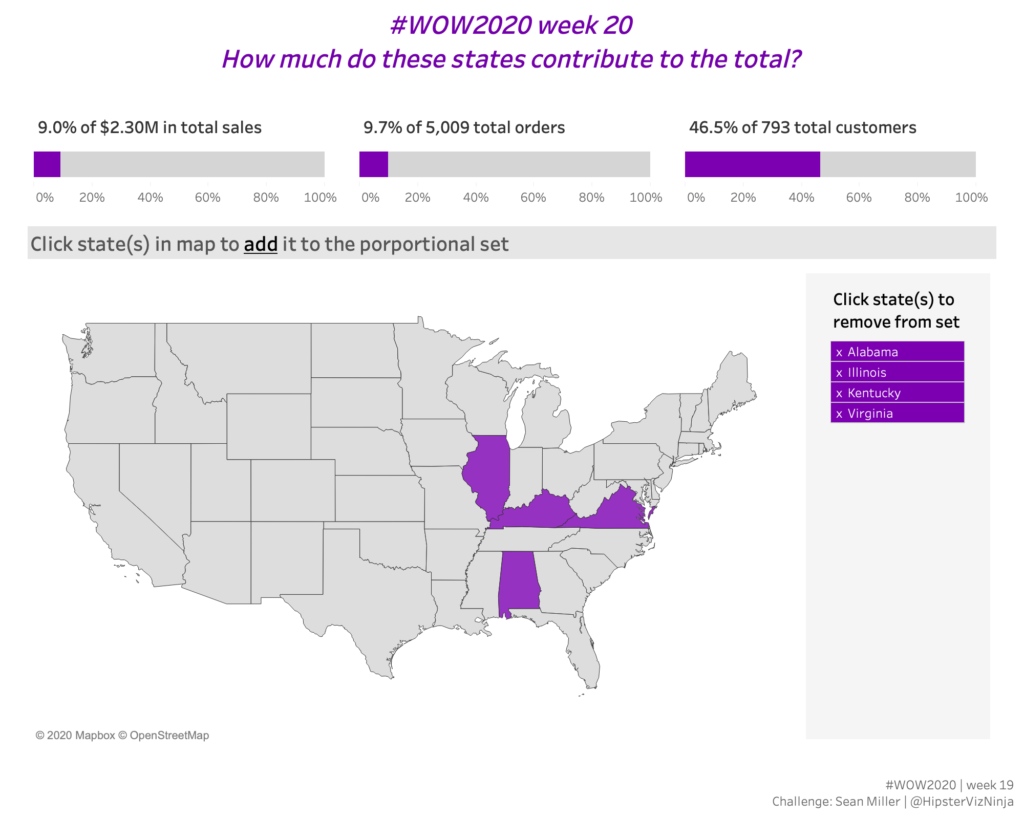
2020 Week 20: How much do these states contribute to the total? Read More
Introduction But first… Well, this is it! This week marks my final WorkoutWednesday challenge. Its been so much fun contributing the last couple of months, I hope you enjoy my challenges. But I’ve still got one more, this one. So let’s get to it. The Challenge If you haven’t heard, Tableau version 2020.1 has been …
WOW2020 Week 10: Can you use spatial BUFFER() functions in 2 ways? Read More
There is still a need for legacy reporting, how can we use Tableau to create a report where one row contains all the data? Here’s how to create a concatenated list of values
Introduction Well here we are! My first week as an “official” contributor of #WorkoutWednesday! I’m so excited to share my three (3) challenges with you so let’s get to it with the first one. In my day to day life at Cerner, I build analytics that cast a wide net of user personas with all …
Week 04: Can you combine relative and custom dates? Read More
Introduction In the UK you’ll find most households celebrating Christmas will have at least one box or tub of chocolate selection boxes. This year my family went for Cadbury Roses (although Celebrations are my favourite). I spotted this viz of the day on Tableau Public this week. I knew that I had to have a play with …
Introduction EDITOR’S NOTE: This challenge was originally published on Emma Whyte’s Tableau blog which no longer exists. This challenge is republished here with the author’s permissions. This week I’ve taken a look at UK Box Office data, downloaded from BFI. Click to open in Tableau Public Requirements Your task this week is to remake the visualisation …