Introduction
Hey friends! We all know that Tableau has so many amazing capabilities where nearly anything is possible. Have you ever thought about what you can do out-of-the-box? I’m talking no hacks, no LODs, no table calculations, no actions, just load up a dataset build something amazing.
That’s what this challenge is all about. With the one exception, you’ll need one calculation…and I’ll give it to you. Have a great week.
Requirements
- Dashboard Size: 100px by 800 px
- # of Sheets – 3
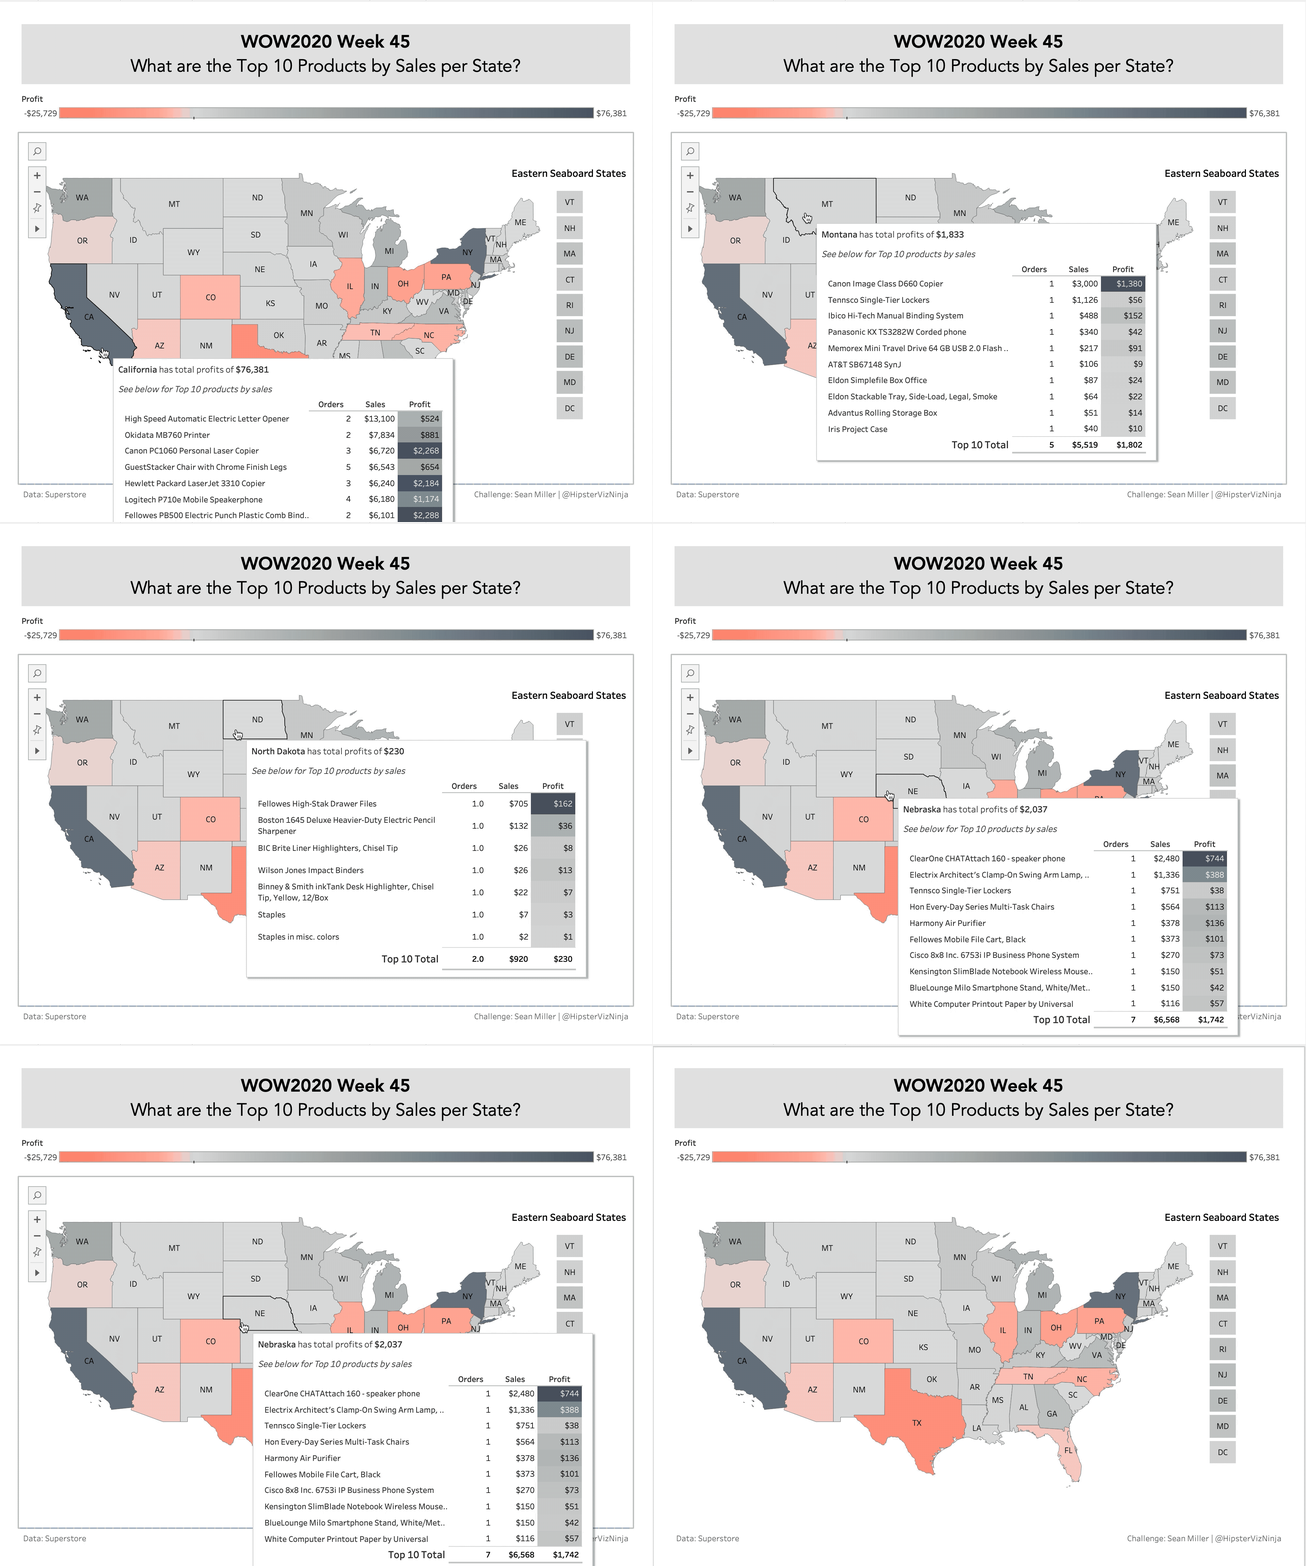
- Create a map displaying Profit by color
- Create an easy-to-interact vertical for the smaller northeastern seaboard states
- Vermont
- New Hampshire
- Massachusetts
- Connecticut
- Rhode Island
- New Jersey
- Delaware
- Maryland
- District of Columbia
- Create an easy-to-interact vertical for the smaller northeastern seaboard states
- Create a tooltip that shows a table of the top 10 products by sales for each state and for each, show
- # of orders
- total sales
- total profit
- *Only total profit should be colored
- Add grand totals
- Match all other formatting
Here is the State abbreviation calculation for the state mark labels:
CASE [State]
WHEN “Alabama” THEN “AL”
WHEN “Alaska” THEN “AK”
WHEN “Arkansas” THEN “AR”
WHEN “Arizona” THEN “AZ”
WHEN “California” THEN “CA”
WHEN “Colorado” THEN “CO”
WHEN “Connecticut” THEN “CT”
WHEN “Delaware” THEN “DE”
WHEN “District of Columbia” THEN “DC”
WHEN “Florida” THEN “FL”
WHEN “Georgia” THEN “GA”
WHEN “Idaho” THEN “ID”
WHEN “Illinois” THEN “IL”
WHEN “Indiana” THEN “IN”
WHEN “Iowa” THEN “IA”
WHEN “Kansas” THEN “KS”
WHEN “Kentucky” THEN “KY”
WHEN “Louisiana” THEN “LA”
WHEN “Maine” THEN “ME”
WHEN “Maryland” THEN “MD”
WHEN “Massachusetts” THEN “MA”
WHEN “Michigan” THEN “MI”
WHEN “Minnesota” THEN “MN”
WHEN “Mississippi” THEN “MS”
WHEN “Missouri” THEN “MO”
WHEN “Montana” THEN “MT”
WHEN “Nebraska” THEN “NE”
WHEN “Nevada” THEN “NV”
WHEN “New Hampshire” THEN “NH”
WHEN “New Jersey” THEN “NJ”
WHEN “New Mexico” THEN “NM”
WHEN “New York” THEN “NY”
WHEN “North Carolina” THEN “NC”
WHEN “North Dakota” THEN “ND”
WHEN “Ohio” THEN “OH”
WHEN “Oklahoma” THEN “OK”
WHEN “Oregon” THEN “OR”
WHEN “Pennsylvania” THEN “PA”
WHEN “Rhode Island” THEN “RI”
WHEN “South Carolina” THEN “SC”
WHEN “South Dakota” THEN “SD”
WHEN “Tennessee” THEN “TN”
WHEN “Texas” THEN “TX”
WHEN “Utah” THEN “UT”
WHEN “Vermont” THEN “VT”
WHEN “Virginia” THEN “VA”
WHEN “Washington” THEN “WA”
WHEN “West Virginia” THEN “WV”
WHEN “Wisconsin” THEN “WI”
WHEN “Wyoming” THEN “WY”
END
Dataset
This week uses the superstore dataset for Tableau 2019.4. You can get it here at data.world
Attribute
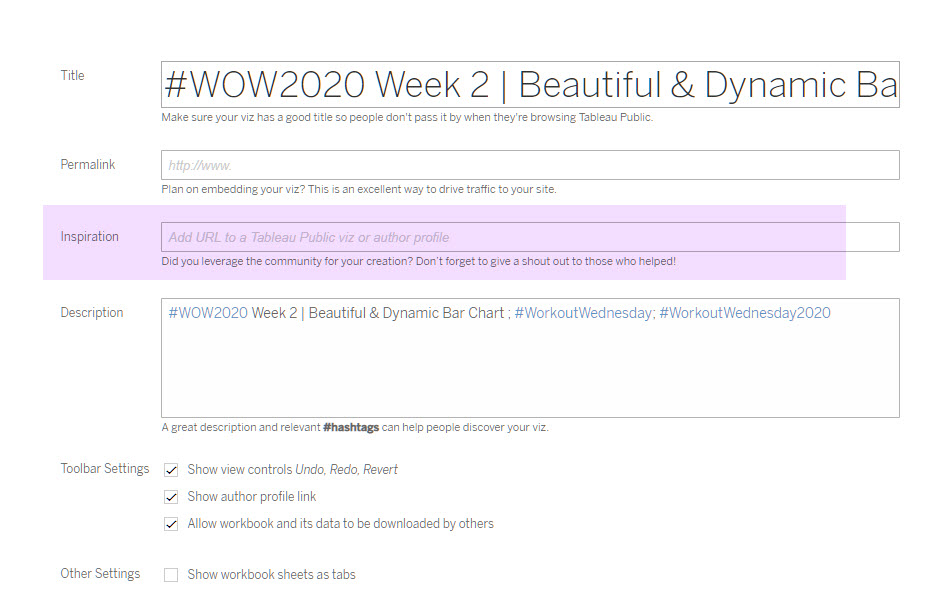
When you publish your solution on Tableau Public make sure to take the time and include a link to the original inspiration. Also include the hashtag #WOW2020 in your description to make it searchable!

Share
After you finish your workout, share on Twitter using the hashtag #WOW2020 and tag @AnnUJackson, @LukeStanke, @_Lorna_Brown and @HipsterVizNinja


Hi, where can we expect the solution to be published?