
Introduction
But first…
Well, this is it! This week marks my final WorkoutWednesday challenge. Its been so much fun contributing the last couple of months, I hope you enjoy my challenges. But I’ve still got one more, this one. So let’s get to it.
The Challenge
If you haven’t heard, Tableau version 2020.1 has been released and it is a power-packed release!
- Viz Animation
- Dynamic parameters
- spatial buffer functions
And that last bullet is the main features of this challenge. And in order to use the new buffer calculation, your data must include geo-coded data. Because of that, Superstore is not going to be a good dataset so we’re going with custom data set I created. With the upcoming Tableau Conference – Europe coming up later this summer, I felt that many of you have begun planning your trip. Besides all the great things that go down at Tableau conference, it’s also a great opportunity to get out and explore. This year’s European conference is being held in London, UK!
You’re objective this week is to visualize London hotels and pubs using the Buffer() function! To help you get started, there have been a couple of excellent blog posts written that I encourage you to check out while completing this challenge.
- Tableau Zen Master, Marc Reid wrote up an excellent walkthrough stepping you through the how and the why and provides a really nice workbook for you to check out.
- Tableau Developer, Filippos Lymperopoulos presented buffer() calculations at Devs on Stage at Tableau Conference 2019 in Vegas. Recently, he wrote up a blog post walking through what he showed on stage.
Both of these posts will help you with this week’s challenge.
But here at #WOW2020, we like to take things one step further. While the posts above do a great job of the “how to DO” we strive for showing you “how to APPLY” techniques to your existing workflows.
There are two primary use cases for primary buffer() calculations, this challenge presents both for you to decide which one tackle (or both!).
Requirements
Intermediate Challenge
- Dashboard Size: 700px by 700 px
- Create a Map that shows the number of pubs within a 500-meter buffer of each hotel
- If no pubs are within that radius DO NOT show the hotel
- Label each hotel with the number of pubs in the radius
- Tooltip
- Show the list of pubs in the radius
- Show the distance (meters)
- Sort ascending by distance
Once you get this, play around with setting different size radii or join types (was that a spoiler?)
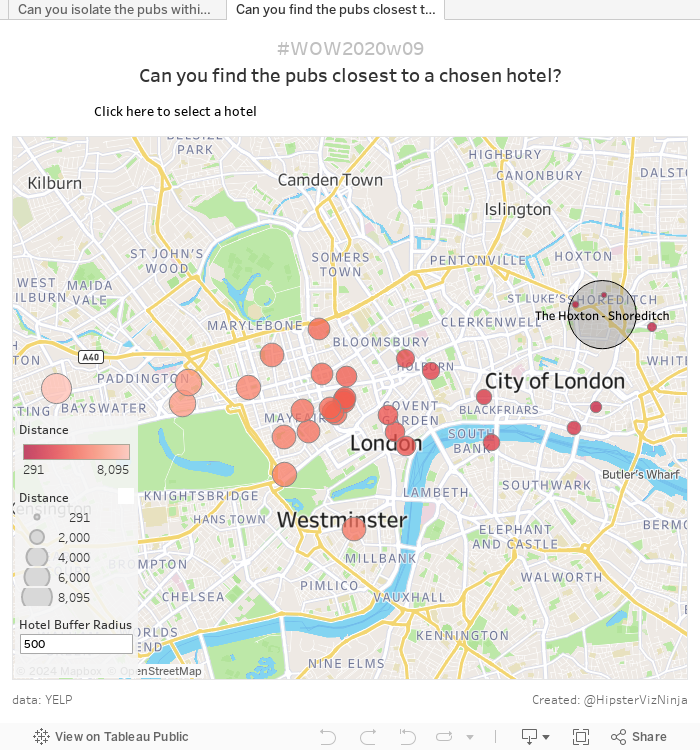
Jedi Challenge
- Dashboard Size: 700px by 700 px
- Create a dashboard with a map & collapsible container that allows the user to sort the list of hotels by 3 measures
- Number of ratings
- Yelp Rating
- Price Rating
- When the user selects a hotel:
- Show the hotel on the map with a gray dynamic buffer zone
- Size the pubs by the distance to the selected hotel
- Color the pubs (ascending) by the distance to the selected hotel
- Match Tooltips
- Match Legend
NOTE: I noticed intermittent buffer issues when I this to Tableau Public. So just confirm it works on Desktop
Dataset
This is a custom dataset that I created. You can get it here at data.world. There are 3 data sets at this link. The Intermediate challenge uses BOTH:
- London Hotel
- London Pubs
The Jedi challenge uses
- Hotels_Pubs Combined
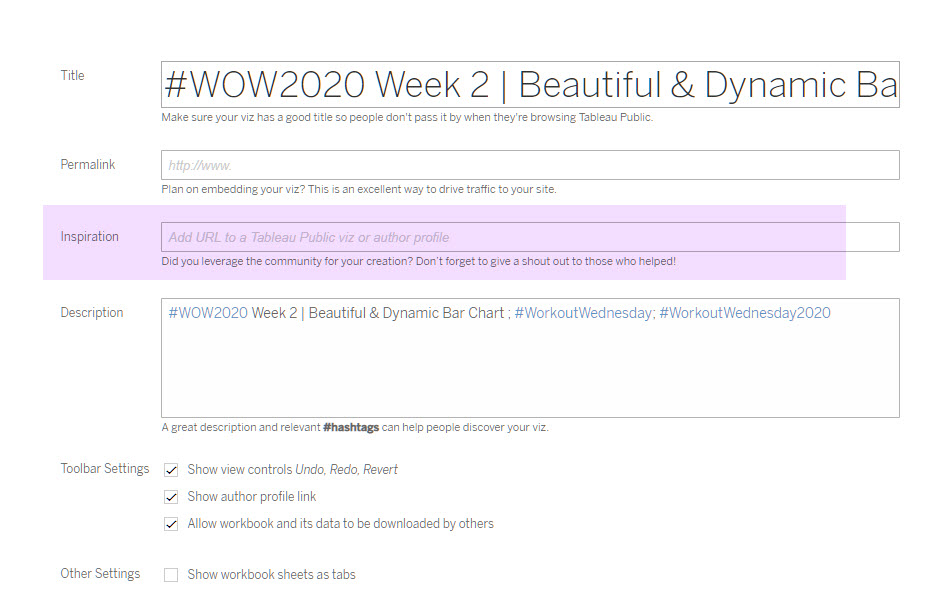
Attribute
When you publish your solution on Tableau Public make sure to take the time and include a link to the original inspiration. Also include the hashtag #WOW2020 in your description to make it searchable!
Share
After you finish your workout, share on Twitter using the hashtag #WOW2020 and tag @AnnUJackson, @LukeStanke, @lorna_eden, and @HipsterVizNinja
Solution
Interactive
i can’t post any link…