#WOW2017 | 36 | Disney Domination
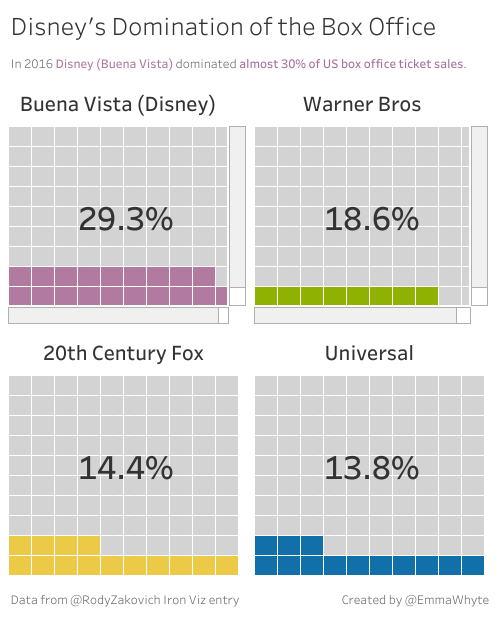
Introduction EDITOR’S NOTE: This challenge was originally published on Emma Whyte’s Tableau blog which no longer exists. This challenge is republished here with the author’s permissions This weeks #WorkoutWednesday is inspired by an IronViz entry from Rody Zakovich. I’m a huge Disney fan and think Rody’s viz is the right balance of informative and eye-catching. I …