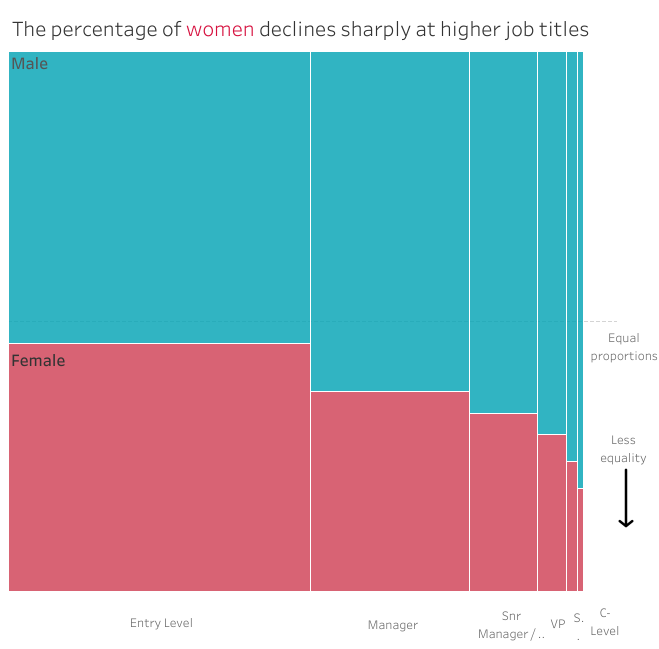
#WOW2017 | 08 | Marimekko Makeover
Introduction EDITOR’S NOTE: This challenge was originally published on Emma Whyte’s Tableau blog which no longer exists. This challenge is republished here with the author’s permissions This week I decided to re-create a makeover from Junk Charts in Tableau. This image originally appeared in The Wall Street Journal and shows the percentage of men and women employed …