Sigma

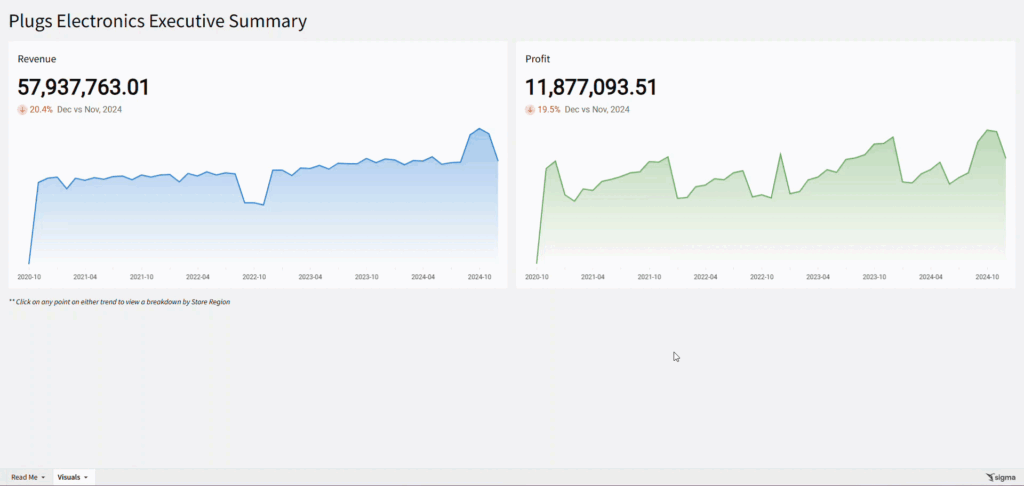
2024 Week 8 | Sigma: Can you customize this tooltip?

Introduction A good data visualization strikes a balance between enough and too much information. For this week’s challenge, we will explore a couple of ways to customize tooltips. Customizing these can help provide users with meaningful information without overwhelming or crowding the visuals. I’m sure you’ll knock this one out of the park! Need access …

2024 Week 8 | Sigma: Can you customize this tooltip? Read More

A Line Graph that changes between different date granularities

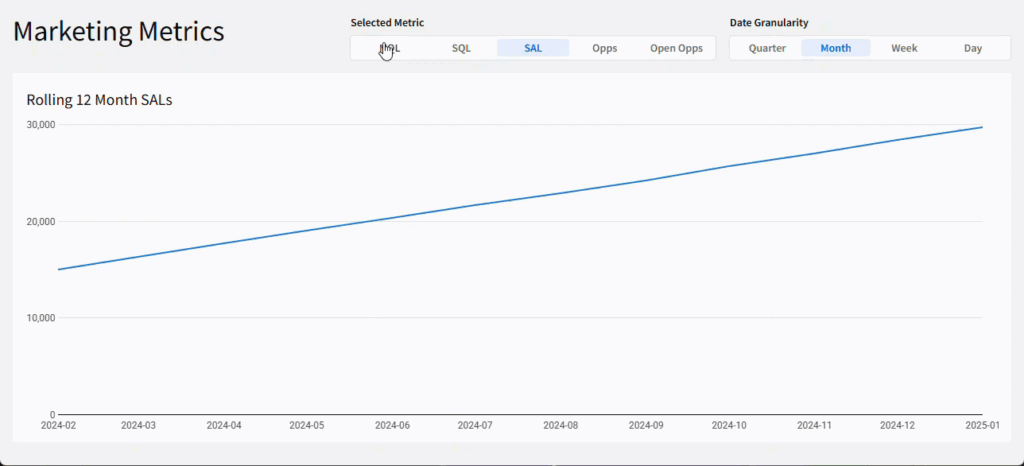
2024 Week 7 | Sigma: Can you recreate this Line Graph?

Introduction Welcome to Week Seven! This week, you’re going to create a line graph that can change its date granularity.  With a dynamic x-axis, this graph allows users to view trends at the level that makes sense for their current needs, without duplicating work. Also in this challenge, you’re going to learn how to show …

2024 Week 7 | Sigma: Can you recreate this Line Graph? Read More

Screenshot of some text that displays a secret message

2024 Week 6 | Sigma: Can you keep a secret with Row Level Security?

Introduction This week’s challenge features *secret messages*! It’s not a flashy visual, but it showcases two important features of Sigma that any developer *must* know: Input Tables and Row Level Security. Input Tables allow Sigma users to interact with the data warehouse directly by manipulating tables at the cell-level in Sigma. These input tables can …

2024 Week 6 | Sigma: Can you keep a secret with Row Level Security? Read More

2024 Week 5 | Sigma: Can you use dynamic text to report on KPIs?

Introduction Welcome to Week Five 🖐🏼 This week’s challenge is all about crafting an impactful headline. Whether it’s for the top of a dashboard or a key component of a presentation, the goal is to effectively highlight KPI performance of email campaigns through Hubspot. We’ll be utilizing Sigma’s dynamic text feature, drawing data directly from …

2024 Week 5 | Sigma: Can you use dynamic text to report on KPIs? Read More

2024 Week 4 | Sigma: Can you recreate this KPI Chart?

Introduction Welcome to Week Four! This week, we’re going to create a single element that shows multiple pieces for analysis. This challenge is easier than last week, and is meant to show how quickly Sigma can perform period over period analysis on any KPI.  Good Luck!-Ashley Need access to Sigma? Click Here to Sign Up …

2024 Week 4 | Sigma: Can you recreate this KPI Chart? Read More

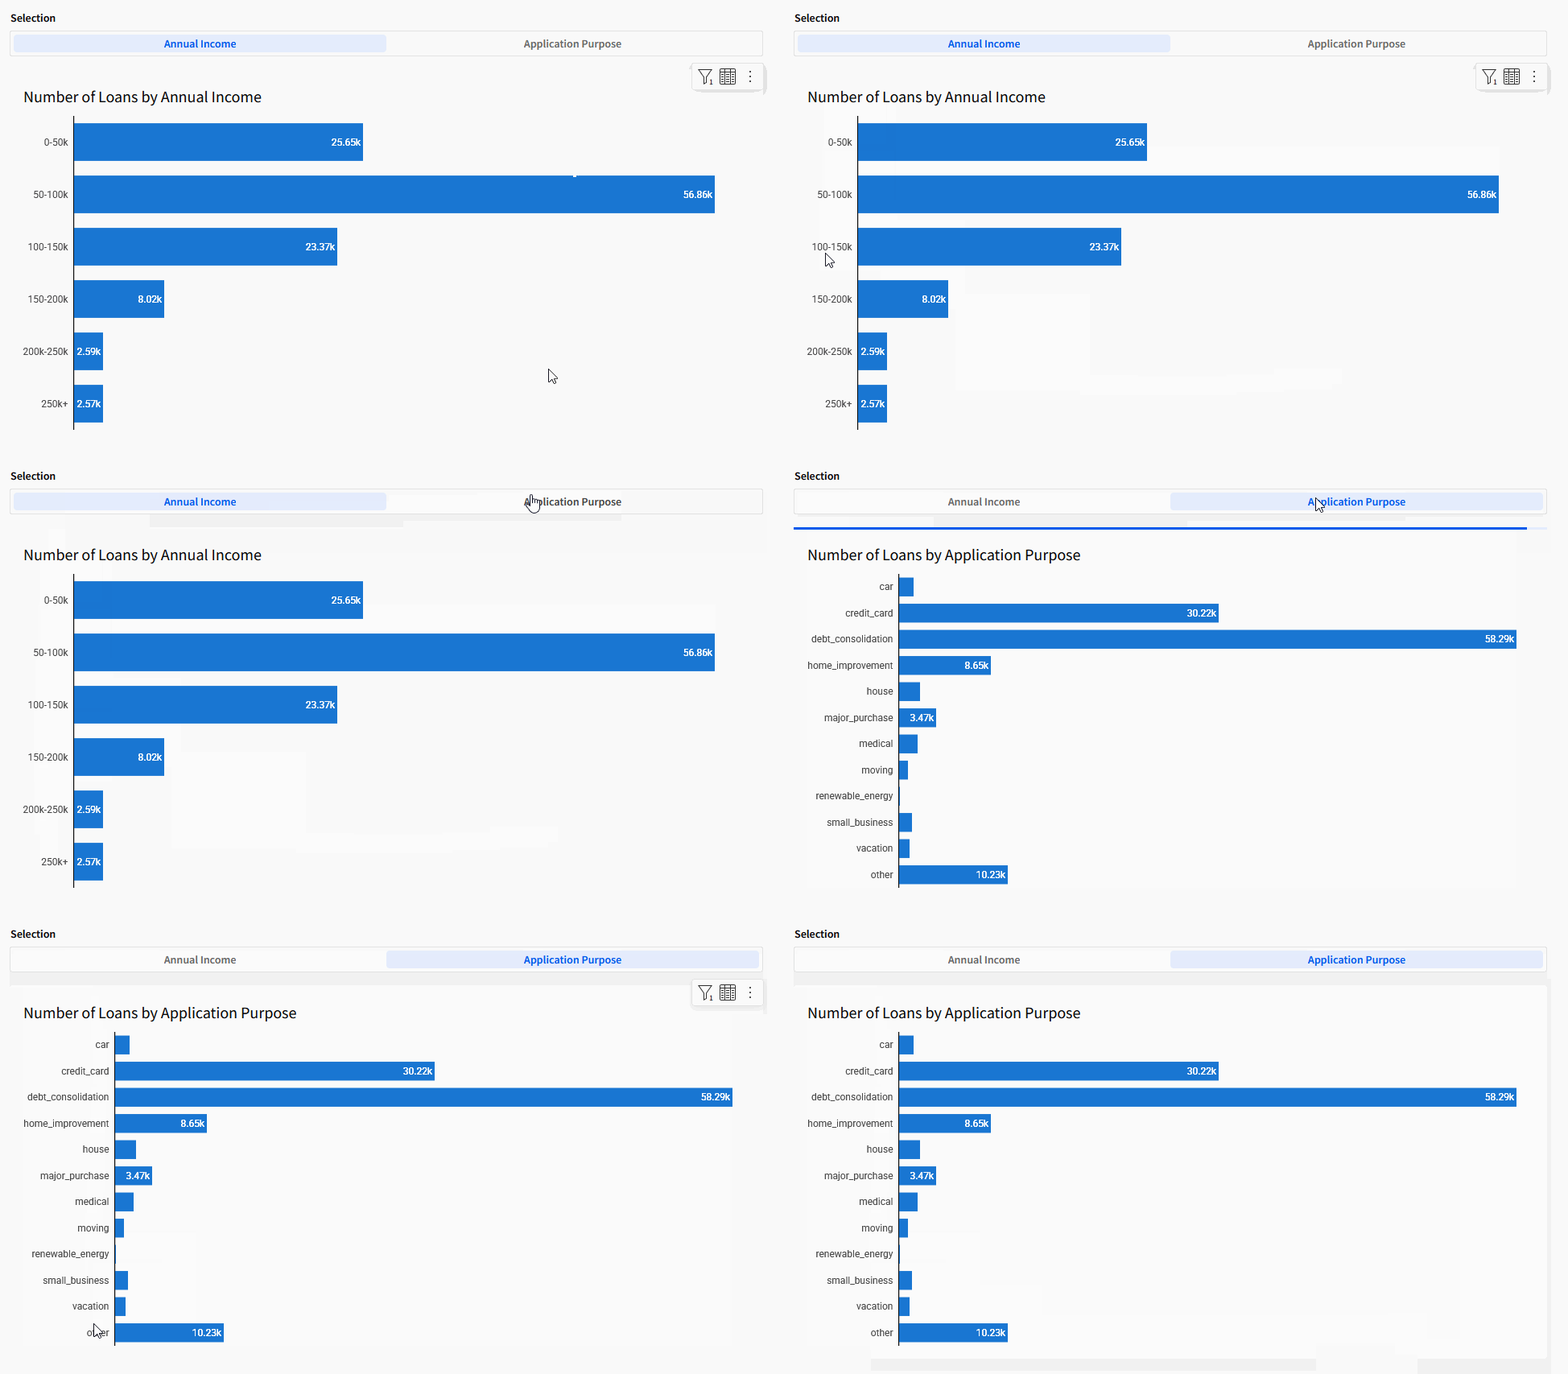
2024 Week 2 | Sigma: Can you recreate this drillable bar chart?

Introduction Let’s keep the new year rolling! I’m Eric, and I’m really excited to host this week. Thanks to all the folks who have participated so far, we look forward to seeing more of your submissions this week. Today, I’m excited to give you a challenge that gets you familiar with drilling in Sigma. Let’s …

2024 Week 2 | Sigma: Can you recreate this drillable bar chart? Read More

2024 Week 1 | Sigma: Can you recreate this Area Chart?

Introduction It’s an exciting moment as we launch the first-ever Sigma Computing Workout Wednesday Challenge! WOW was a key aspect in my career, and I’m thrilled to bring these challenges to a new platform. These challenges are designed to help you explore new possibilities, practice essential concepts, and deepen your understanding of Sigma & data …

2024 Week 1 | Sigma: Can you recreate this Area Chart? Read More

Introducing Sigma Computing to Workout Wednesday

The wait is over! Sigma Computing is now part of Workout Wednesday. The Sigma WOW Team is excited to help you learn a platform we love.  We’ll present you with a unique WOW challenge each week to enhance your skills and ignite your passion for data. These challenges range from beginner-friendly tasks to more advanced …

Introducing Sigma Computing to Workout Wednesday Read More

Scroll to Top