Introduction
Welcome to Week Thirty-Six! This week, we’re going to focus on some more advanced filtering.
By now, you should know how to utilize a page control’s targets to filter a single column in an element. What do you do when you need to affect multiple columns in the same element? You can utilize a new column in the data table!
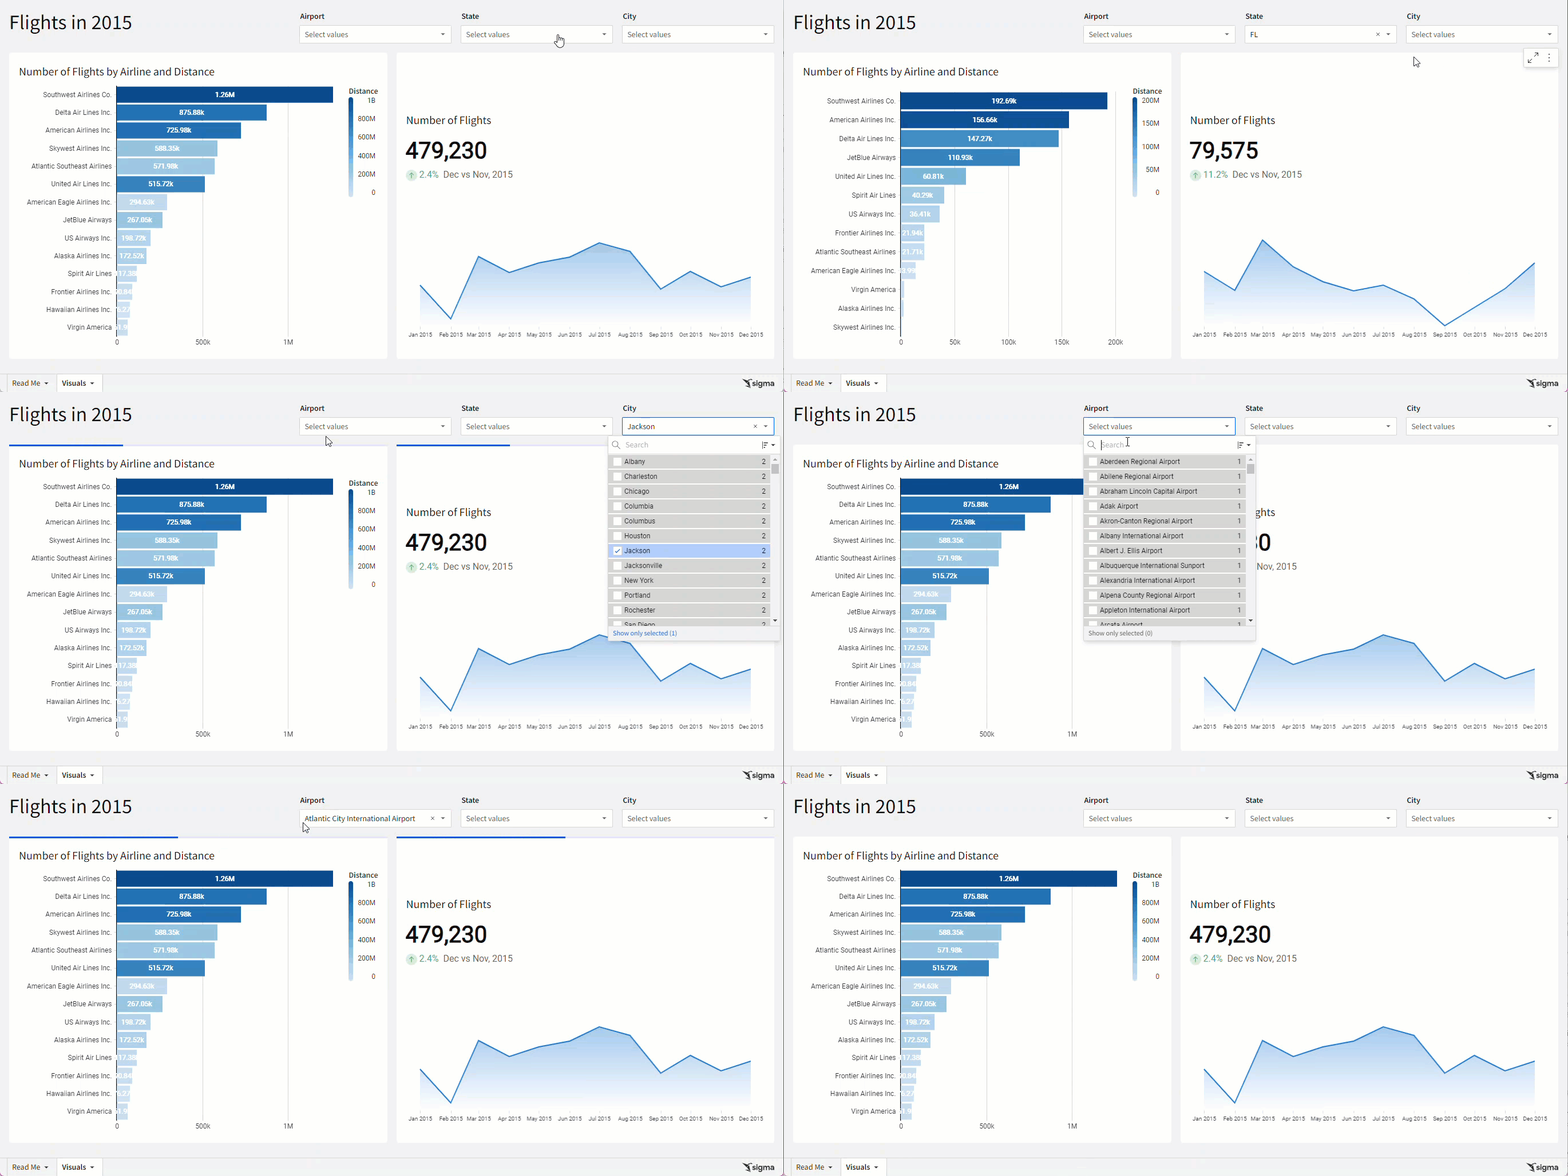
In this challenge, you will create a small dashboard that filters the origin and destination airports with the same filters.
Good Luck!
-Ashley
Need access to Sigma?
Note: You will only have view access to WOW Workbooks, Folders, and Workspaces, not edit access. Please create your WOW Workbooks under “My Documents.” We suggest creating a folder to organize all your workbooks.
Requirements
- On a hidden Data Tab:
- Add all of the tables in the FAA Schema (FUN / FAA):
- Flights
- Airlines
- Airports
- Note the pre-defined Metrics available in the Flights table. We will use Number of Flights and Distance Travelled.
- Use the Lookup Wizard to add new columns to the Flight Table:
- Airline Name
- Origin Airport
- Origin City
- Origin State
- Destination Airport
- Destination City
- Destination State
- Make a new Flight Date column using the date parts in the table.
- Add all of the tables in the FAA Schema (FUN / FAA):
- On a visible page:
- Create an unstacked horizontal bar graph:
- X-Axis: Airline Name
- Y-Axis: Number of Flights formatted to SI Units
- Color: Distance Travelled formatted to SI Units. Give this column a shorter name, to reduce the size of the legend.
- Add a ToolTip that shows the full value Number of Flights and Distance Travelled, and hides the SI Unit versions
- Show the Data Labels & Legend Header
- Sort to show the Airline with the most flights on top
- Create a KPI Chart
- Value: Number of Flights
- Timeline: Month of Flight Date
- Comparison: Previous Month
- Show the ToolTip and Y-Axis
- Create a Control: Airport
-
- Value Source: Airports table on the hidden tab
- Source Column: Airport
- Uncheck “Show null option”
-
- Create a Control: State
-
- Value Source: Airports table on the hidden tab
- Source Column: State
- Uncheck “Show null option”
-
- Create a Control: City
-
- Value Source: Airports table on the hidden tab
- Source Column: City
- Uncheck “Show null option”
-
- Create an unstacked horizontal bar graph:
- Create your filtering columns in the Flights table:
- For each of the page controls, add a new column that contains a formula:
- First, check if the control’s value has an array length greater than zero. If the length is not greater than zero, the column’s output should always be True.
- Then, check if the control’s value array contains the corresponding Origin OR Destination value.
- Finally, filter the Flights table so that only True values show in these columns.
- For each of the page controls, add a new column that contains a formula:
- Finishing Touches
-
- Give the Page a Descriptive Title
- Arrange your elements into a cohesive dashboard
-
Dataset
FUN / FAA:
- Flights
- Airlines
- Airports
Share
After you finish your workout, share on LinkedIn, Sigma’s Community page, (or Twitter) using the hashtags #WOW2024 and #SigmaComputing, and tag Ashley Bennett, Eric Heidbreder, Katrina Menne, and Michal Shaffer!
Create an interactive, sharable version of your solution here.
Also, make sure to fill out the Submission Tracker so that we can count you as a participant this week to track our participation throughout the year.


